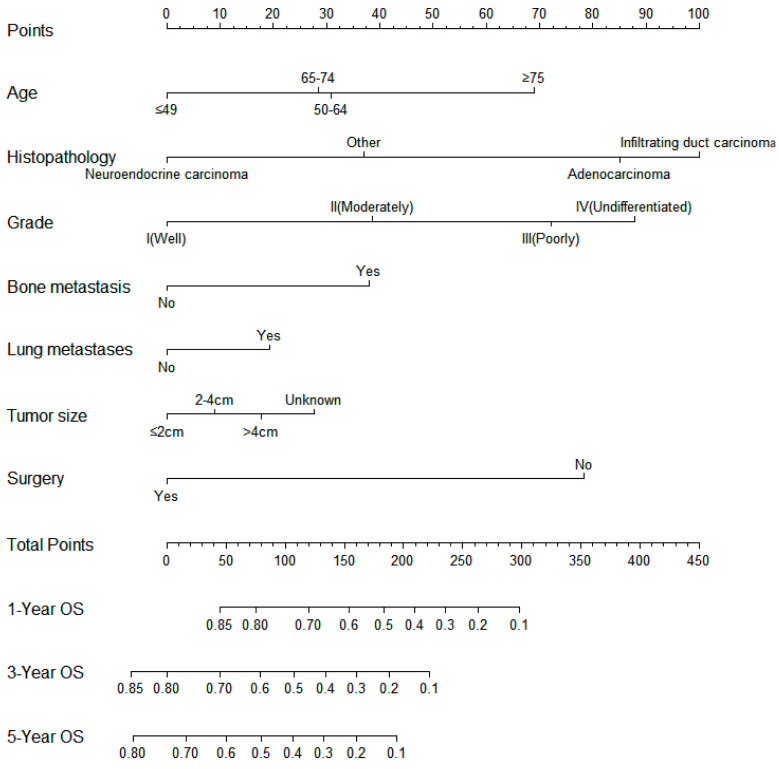
Figure 3.
Nomogram model for predicting the overall survival in patients with liver metastases from pancreatic cancer. The scale corresponds to the variable axis according to the patient variables. The overall probability of patient survival at 1, 3, and 5 years can be assessed by drawing a vertical line upward to determine the score for each variable corresponding to the point where the sum of these point scores lies on the total point axis and by drawing a vertical line downward on the survival axis.

