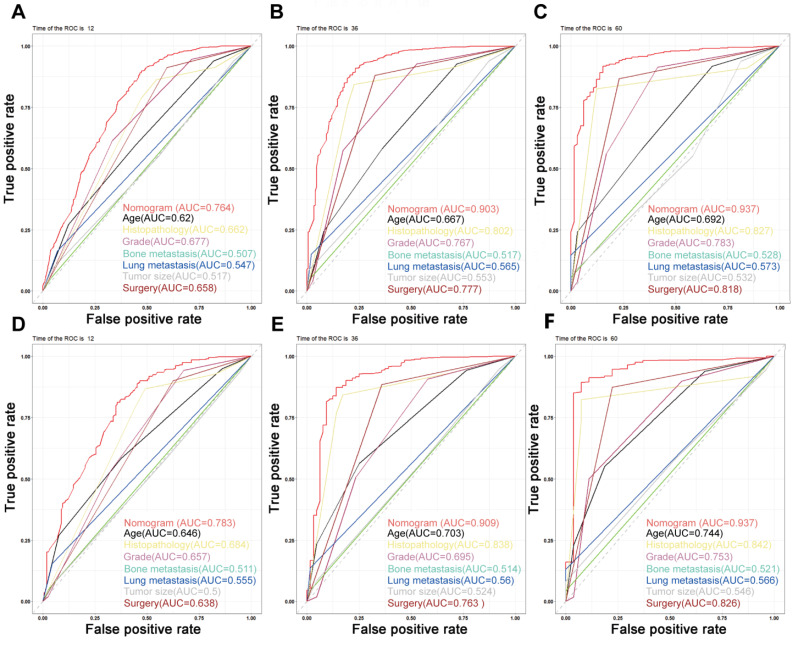
Figure 4.
Time-dependent ROC curves. (A–C) Time-dependent ROC curves for the prognostic nomogram show AUC values of 0.764, 0.903, and 0.937 for predicting the 1-year, 3-year, and 5-year overall survival in the training cohort, respectively. (D–F) The AUC values were 0.783, 0.909, and 0.937 for predicting the 1-, 3-, and 5-year overall survival in the validation cohort, respectively.

