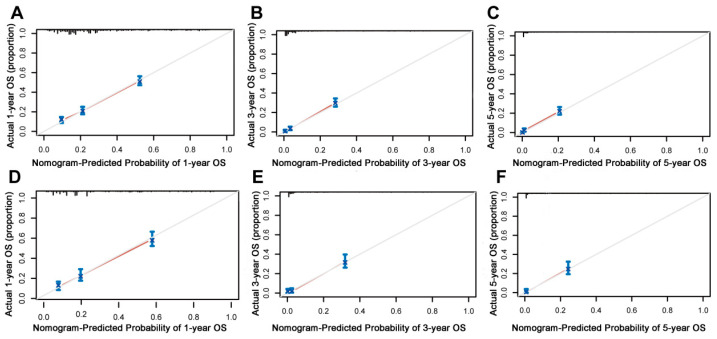
Figure 5.
Calibration curves of the prognostic nomogram model. (A–C) Calibration curves for the 1-year, 3-year, and 5-year overall survival of patients with liver metastases from pancreatic cancer in the training cohort and (D–F) validation cohort. The black line represents the ideal reference line, and the blue line is calculated by bootstrapping (resampling: 1000) and represents the nomogram performance. The closer the solid red line is to the black line, the more accurate the model is at predicting overall survival.

