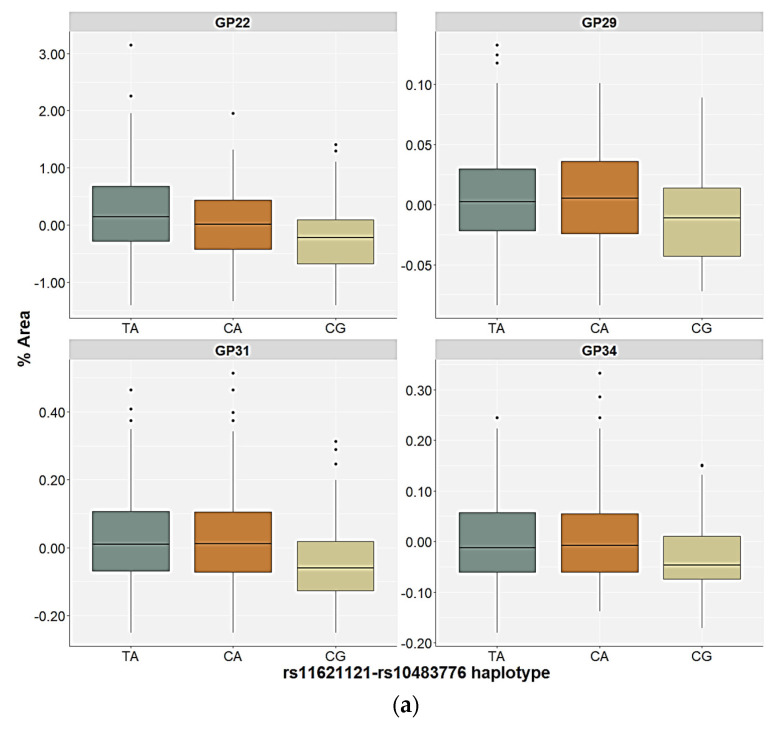
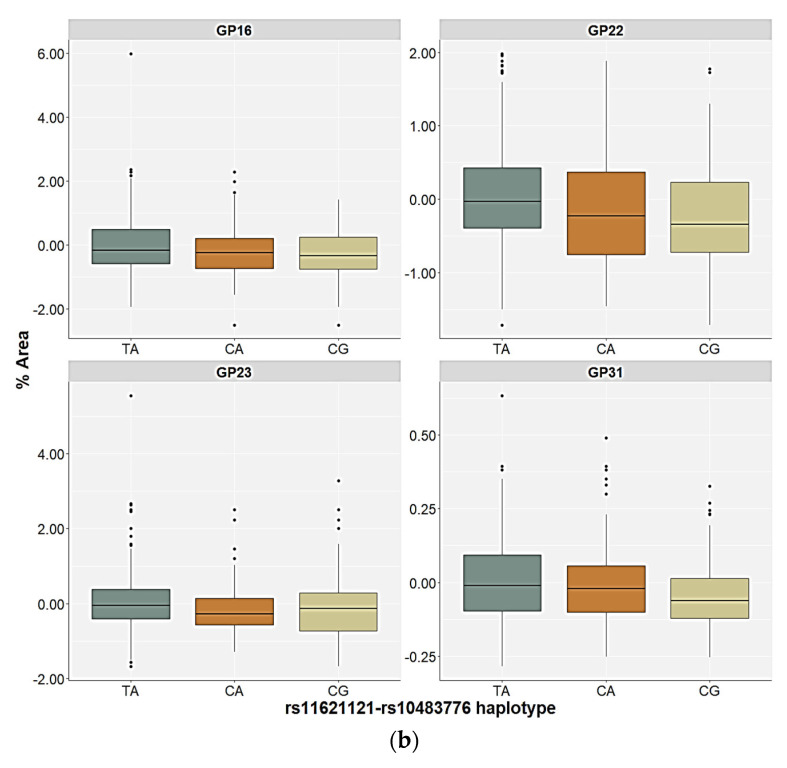
Figure 5.
Relative distribution of the plasma N-glycan levels in the carriers of the different rs11621121–rs10483776 haplotypes in the (a) control and (b) PTSD group. The central box represents the interquartile range of the age-adjusted percentage of the total glycan peak area, the middle line represents the median, the vertical line extends from the minimum to the maximum value, and separate dots represent the outliers.


