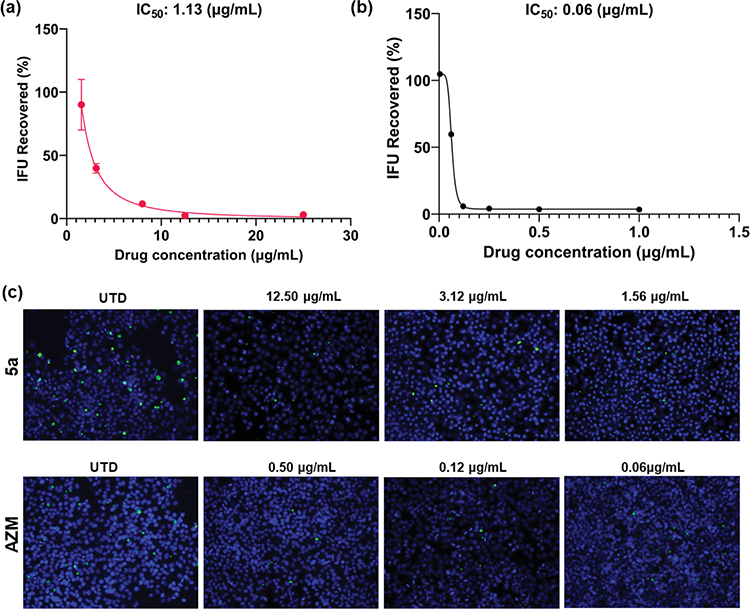
Figure 5.
Dose–response curves for the effect of 5a (a) and AZM (b) reported as the percentage of recovered IFU. Error bars report standard error of the mean (SEM) (N = 3). (c) Immunofluorescence images for the inhibitory effect of 5a and AZM. Chlamydial inclusions are displayed in green (MOMP - Ctr L2) and HEp-2 cell nuclei in blue (4′,6-diamidino-2-phenylindole (DAPI)). Images were acquired on 20× magnification using an Olympus CKX53 fluorescence microscope with EP50 camera. Channel merge was processed using ImageJ software. UTD: untreated; AZM: azithromycin. Omitted error bars indicate a SD value shorter than the size of the symbol presented in the plots.

