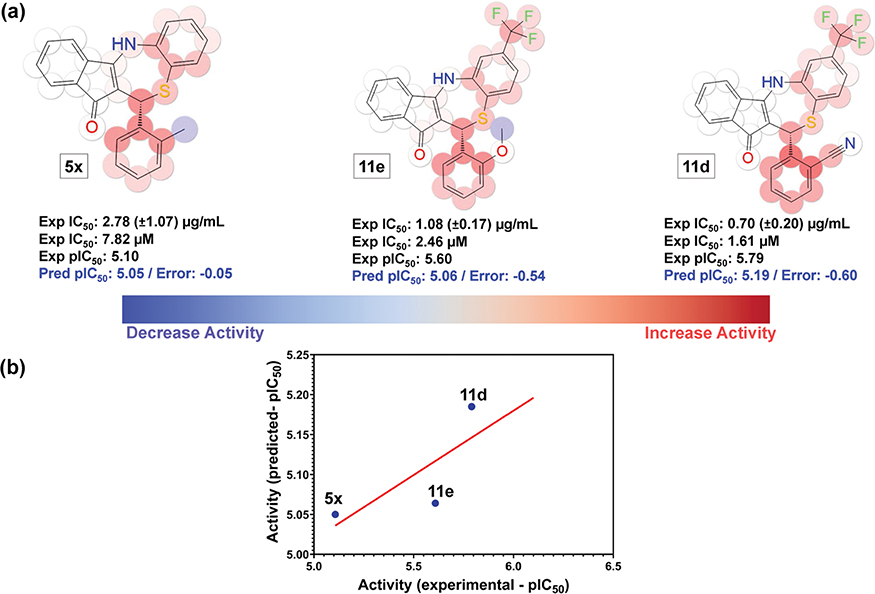
Figure 9.
(a) Predictions color maps for the 2D fingerprint (radial 13) QSAR for molecules 11d, 11e, and 5x. (b) Experimental versus KPLS-radial 2D QSAR model (radial 13) predicted values of antichlamydial activity (pIC50). Atoms displaying a favorable contribution to the antichlamydial activity are colored red and unfavorable are colored blue. The color intensity reflects the strength of the effect. (Note: stereochemistry is displayed because the molecules are drawn in the 3D form, which is required for Maestro software to display the QSAR color maps. However, stereochemistry is not considered in the generation of the 2D descriptors used to build the model).

