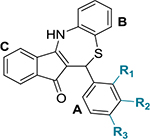
Table 1.
Chemical Structures of Dihydrothiazepine Derivatives 5a–v and Their IC50 against C. trachomatis Serovar L2a

| ||||
|---|---|---|---|---|
| compound | R1 | R2 | R3 | IC50 (μg/mL)b,c |
| 5a | CN | H | H | 1.61 ± 0.11 |
| 5b | OCH3 | H | H | 3.32 ± 0.51 |
| 5c | F | CH3 | H | 4.69 ± 1.20 |
| 5d | H | Cl | H | 4.79 ± 0.19 |
| 5e | H | CF3 | H | 5.18 ± 1.67 |
| 5f | H | NO2 | H | 6.35 ± 0.70 |
| 5g | Cl | H | Cl | 6.37 ± 0.67 |
| 5h | H | H | Cl | 6.59 ± 0.18 |
| H | H | CH3 | 6.72 ± 0.58 | |
| 5j | H | H | OC(O)CH3 | 7.18 ± 0.50 |
| 5k | H | H | OCF3 | 7.44 ± 0.30 |
| 5l | H | H | Br | 7.50 ± 1.01 |
| 5m | H | CN | H | 9.00 ± 1.15 |
| 5n | H | H | NO2 | 9.01 ± 0.25 |
| 5o | H | H | CN | 10.21 ± 1.47 |
| 5P | H | H | OH | 14.41 ± 2.76 |
| 5q | H | H | OCH3 | 14.69 ± 1.26 |
| 334 | H | OH | H | 16.53 ± 0.65 |
| 6a | H | H | NH2 | 17.63 ± 0.43 |
| 5s | H | H | OCH2Ph | 22.76 ± 0.34 |
| 5t | H | H | CO2H | NI |
| 5u | CO2H | H | H | NI |
| 5v | H | H | Ph | NI |
IC50 indicates 50% inhibition of control Chlamydia inclusions. NI: no inhibition seen at the tested concentration range (25–0.39 μg/ mL).
All assays were performed in triplicate.
IC50 values are also presented in μM and pIC50 units in Table S1. The presented data corresponds to mean ± standard deviation (SD).
