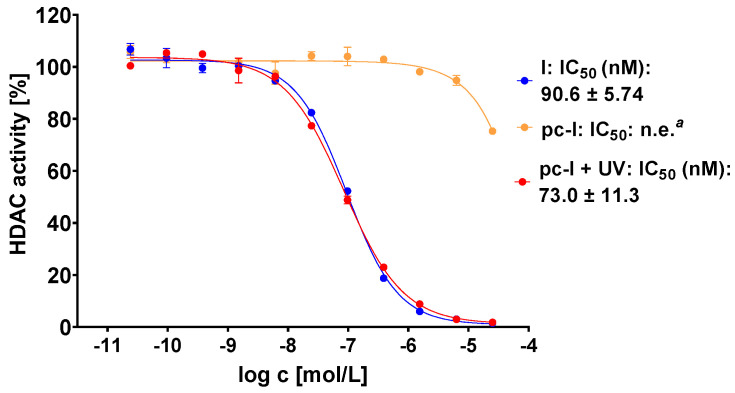
Figure 3.
Representative concentration-effect curves of the whole-cell HDAC inhibition assays of pc-I and I in MV-3 cells. Stated IC50 values were determined from the mean of three independent experiments in duplicates. Irradiation with UV light was executed at 365 nm for 10 min. a n.e: no effect: <25% inhibition at 25 µM.

