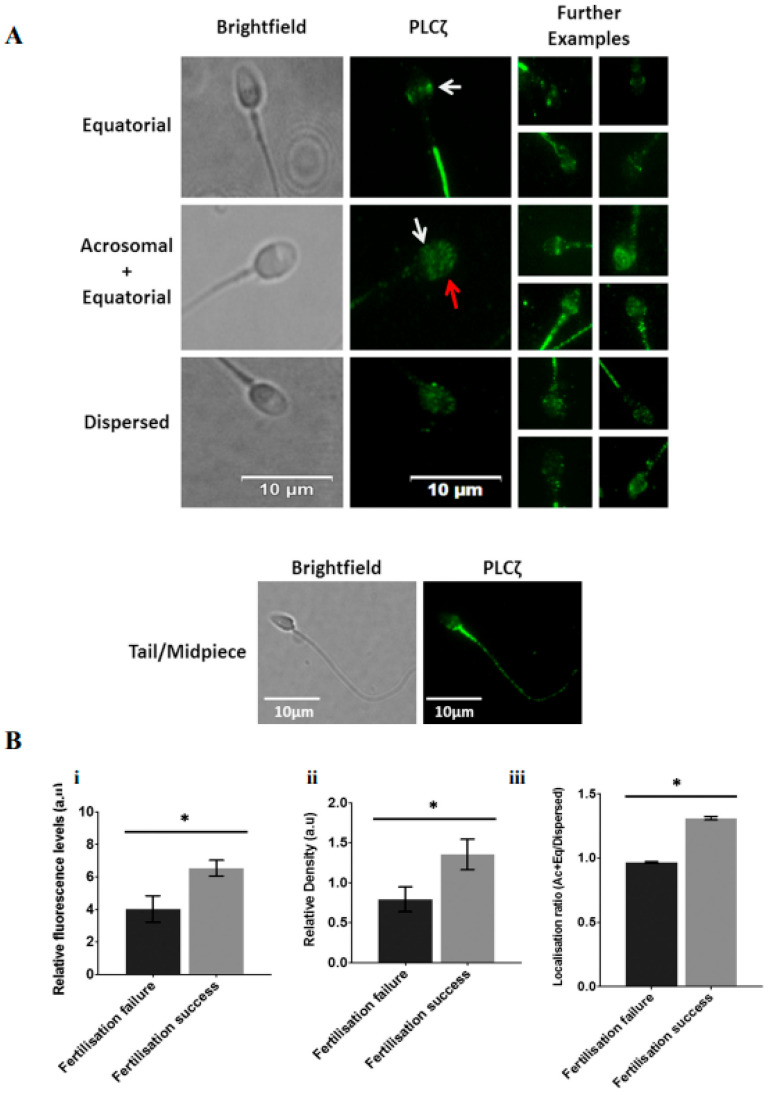
Figure 3.
(A) Representative immunofluorescence images of observed PLCζ localisation patterns in human spermatozoa. Brightfield (leftmost panels) and PLCζ (green fluorescence; middle panel) images were obtained. Predominant localisation patterns observed include equatorial (white arrows), acrosomal + equatorial localisation (red arrow indicates acrosomal localisation), and dispersed localisation patterns. The leftmost panels include further examples of each pattern, illustrating the lack of uniformity of patterns. The bottom-most panel indicates fluorescence observed in the mid-peace and tail. White scale bars represent 10 μm. (B) Histograms indicating differences in (i) relative fluorescence, (ii) relative density and (iii) Ac + Eq/dispersed localisation ratio of sperm PLCζ between cases of fertilisation failure and fertilisation success following fertility treatment. Asterisks (*) indicate statistically significant differences (p ≤ 0.05). Data indicate the potential diagnostic capability of sperm PLCζ parameters in indicating potential fertilisation success. Reprinted with permission from Ref. [99]. Copyright 2020 Andrology.

