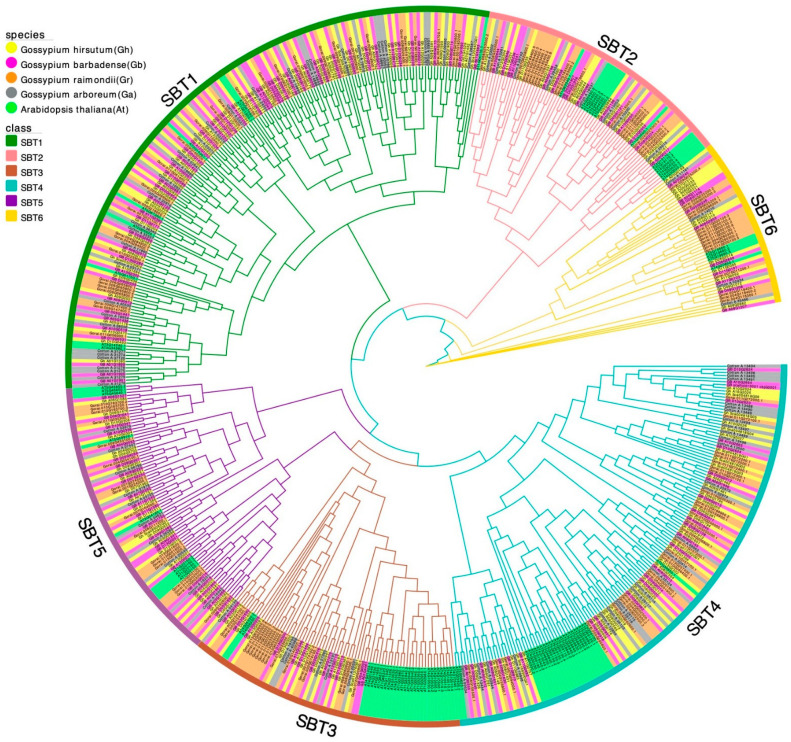
Figure 1.
Phylogenetic relationships of SBT in different species. The circles around the phylogenetic tree (from center to periphery) represent each SBT subfamily and the distribution of species in different colors. Dark green, pink, brown, cyan, purple and dark yellow lines represent subfamilies from SBT1 to SBT6, respectively. Different gene names and background colors indicate different species. Yellow, dark pink, orange, grey and green indicate Gossypium hirsutum, Gossypium barbadense, Gossypium raimondii, Gossypium arboretum and Arabidopsis thaliana, respectively.

