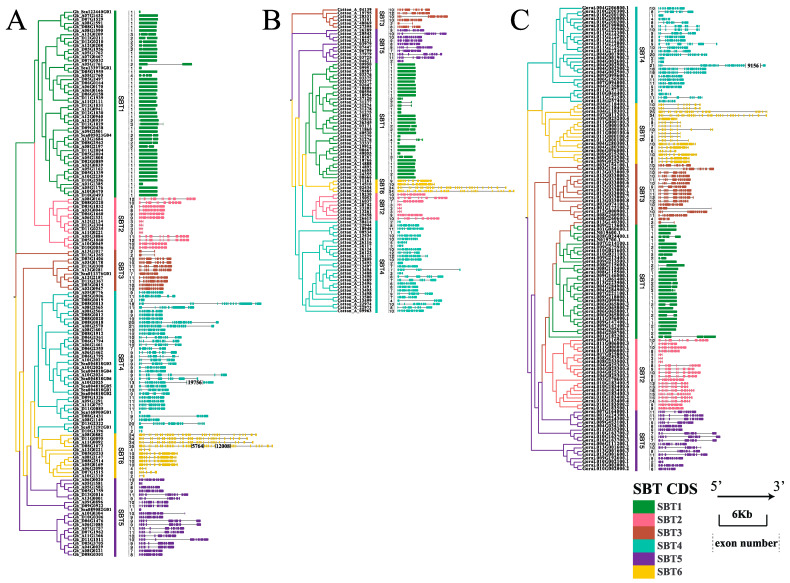
Figure 2.
SBT gene structure of cotton. (A) SBT gene structure of Gossypium hirsutum. The phylogenetic tree is built by FastTree. (B) Genetic structure of Gossypium arboretum. The phylogenetic tree is built by FastTree. (C) Isoform structure of Gossypium raimondii. Different gene models as a result of alternative splicing or alternative start codons are numbered consecutively as Gorai.0XXGXXXXXX.1, .2, etc. The evolution tree is built by FastTree. The squares are CDS, the horizontal lines are introns. Dark green, pink, brown, cyan, purple and dark yellow lines represent subfamilies from SBT1 to SBT6, respectively. The dotted line is exon number.

