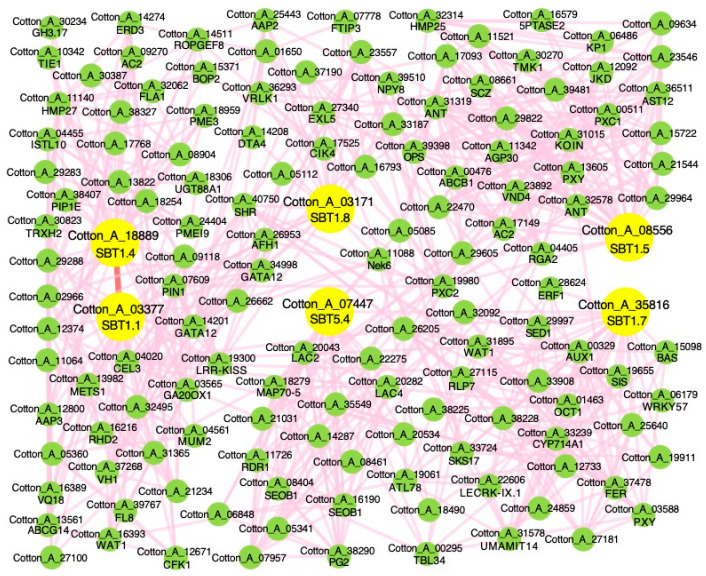
Figure 5.
Gene co-expression network of six Gossypium arboreum SBT gene family members. The green nodes are co-expressed genes, and the large yellow nodes are Gossypium arboreum SBT genes. The pink line shows a co-expression relationship between two genes and the red line indicates SBT gene co-expression.

