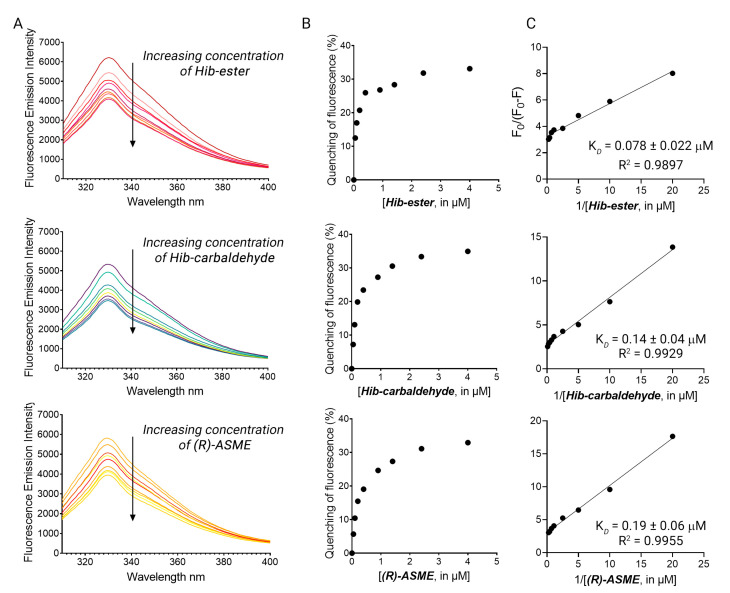
Figure 5.
(A) The fluorescence quenching spectra of LsrK in the presence of Hib-ester, Hib-carbaldehyde, and (R)-ASME, [LsrK] = 0.1 μM, [ligand] ranging from 0 to 4 μM, T = 298 K, pH = 7.4, λex = 280 nm; the experiments were performed in triplicate; (B) % of fluorescence quenching vs. ligand concentration. (C) Modified Stern–Volmer plot for the binding of Hib-ester, Hib-carbaldehyde, and (R)-ASME to LsrK. The points are interpolated using linear regression for the quantification of the KD; the values (±SD) are the results of three independent measurements.

