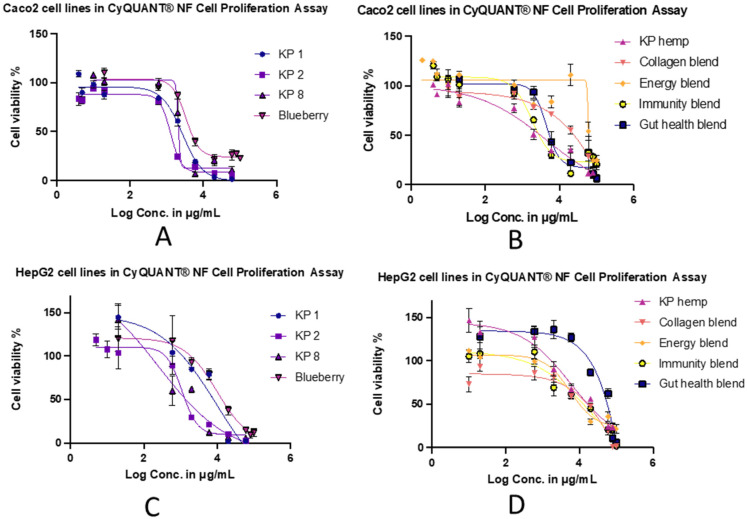
Figure 6.
The treatment–concentration response curves of Kakadu plum powders, Kakadu plum-blended products, and blueberry. (A,B) cell viability with Caco-2 and (C,D) cell viability with HepG2 cells. Data are presented as the mean percentage of cell viability (±SEM) of three replicates for each treatment.

