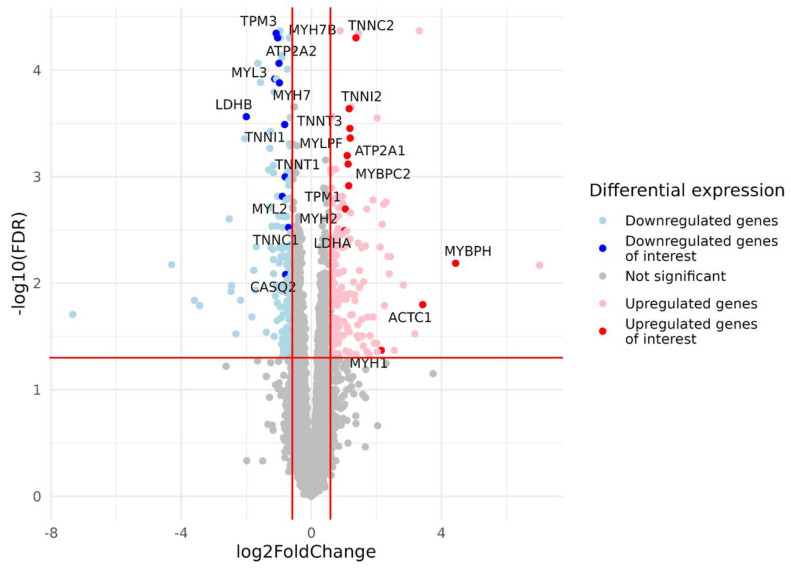
Figure 3.
Volcano plot based on statistical comparison of the gene expression (quasi-likelihood F-test and 5% FDR correction using EdgeR) between the study groups (N = 23). Each dot represents one protein-coding gene. Up- and down-regulated genes are genes with increased and decreased expression in the group with a predominance of fast-twitch fibers (type2) compared to the group with a predominance of slow-twitch fibers (type1). Log2FC value represents type2/type1 CPM ratio. Differentially expressed genes with both FDR < 0.05 and |log2FC| > 0.585 are marked in blue (downregulated genes) or red (upregulated genes). For the genes of interest (Table A2, Appendix A), dots are highlighted, and gene names are provided. Red lines indicate FDR and log2FC thresholds. FDR, false discovery rate; FC, fold change.

