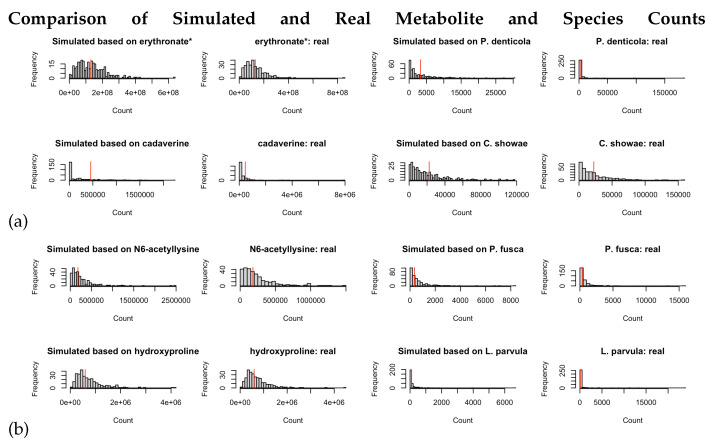
Figure A1.
Evaluation of goodness-of-fit for the ZINB/NB and lognormal models by comparing the histogram of frequency between the simulated data and real data processed in Kraken2/Bracken. The 2nd and 4th columns each contain one species or metabolite from ZOE 2.0. The 1st and 3rd columns contain ZINB simulated data using the parameters estimated from the corresponding species. The 1st and 2nd columns illustrate metabolites, and the 3rd and 4th columns present microbial species. The star at the end of some of the metabolite names indicates that Metabolon, where the metabolome data were generated, is confident in the metabolite’s identity but it has not been confirmed based on a standard. (a) denotes ZINB/NB-based simulation, and (b) denotes ZILN/lognormal based simulation. (a) For two randomly selected metabolites and two randomly selected species (Kraken2/Bracken), comparison of simulated counts drawn from the ZINB distribution (with parameters obtained from models fitted on the real data) and the real data. If the real data have less than 50 out of 289 zeros, the simulated counts are drawn from the negative binomial distribution with no zero inflation. Red vertical lines represent model-based means for each metabolite and species. (b) For two randomly selected metabolites and two randomly selected species (Kraken2/Bracken), comparison of simulated counts drawn from the (ZI-)lognormal distribution (with parameters obtained from models fitted on the real data) and the real data. If the real data have no zeros, the simulated counts are drawn from the lognormal distribution with no zero inflation. Red vertical lines represent the log-scale means of the counts for each metabolite and species.

