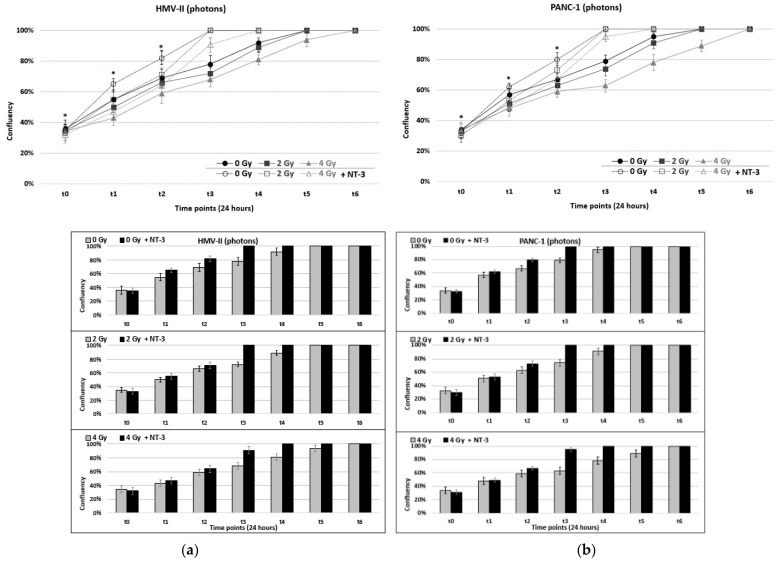
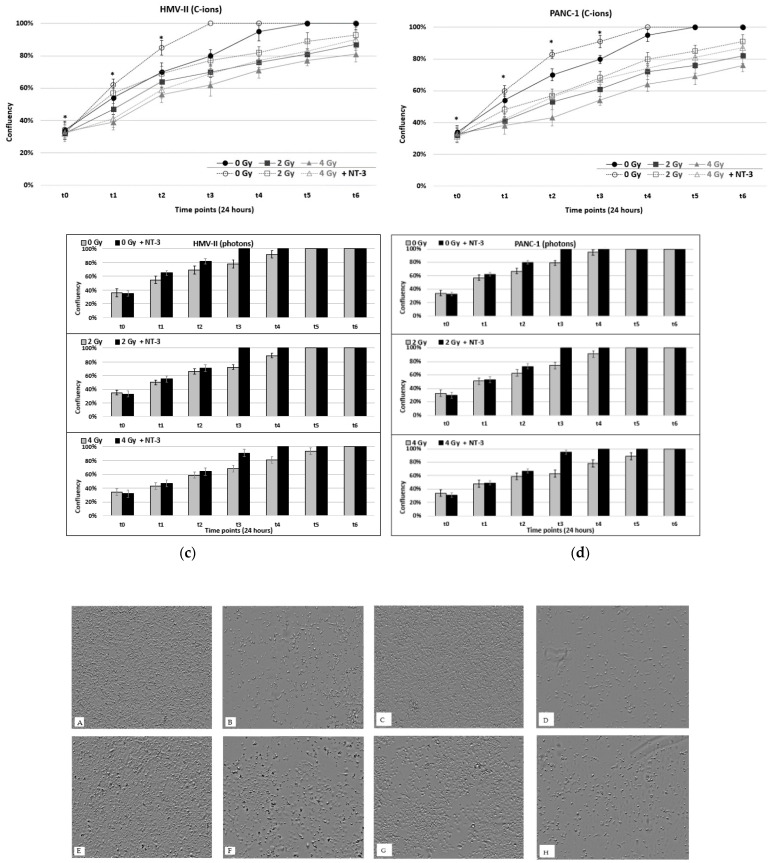
Figure 2.
(a,b) Confluence after the exposure of HMV-II (a) and PANC-1 (b) cells to photons in control conditions and with the addition of NT-3 to each cell line respectively. (c,d) Confluence after the exposure of HMV-II (c) and PANC-1 (d) cells to C-ions in control condition and with the addition of NT-3 to each cell line respectively. Bar graphs correspond to each condition represented by the line graphs, separately. * stands for p ≤ 0.05 and statistically significant differences among 0–2 Gy, 0–4 Gy and 0–2 Gy with NT-3, 0–4 Gy with NT-3 for each time point. (A–H). 4 Gy irradiated HMV-II (A,B,E,F) and PANC-1 (C,D,G,H) cells with and without the addition of NT-3, respectively, at time point t3 with photons in the left panel and C-ions in the right one. Images obtained with the OLYMPUS ProviTM CM20 incubation monitoring system.


