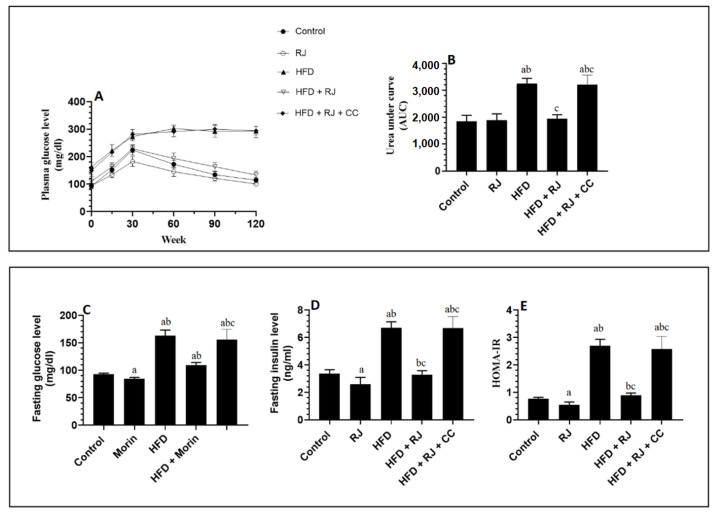
Figure 2.
Changes in glucose levels during the oral glucose tolerance test (OGTT) and its corresponding area under the curve (AUC) (A,B), as well as changes in the fasting plasma glucose (C), fasting plasma insulin (D), and HOMA-IR (E) in all groups of rats. Data are presented as means ± SD (n = 8/group). a: vs. control; b: vs. RJ-treated control rats; c: vs. HFD-model rats; RJ: royal jelly; HFD: high-fat diet; CC: compound C, an AMPK inhibitor.

