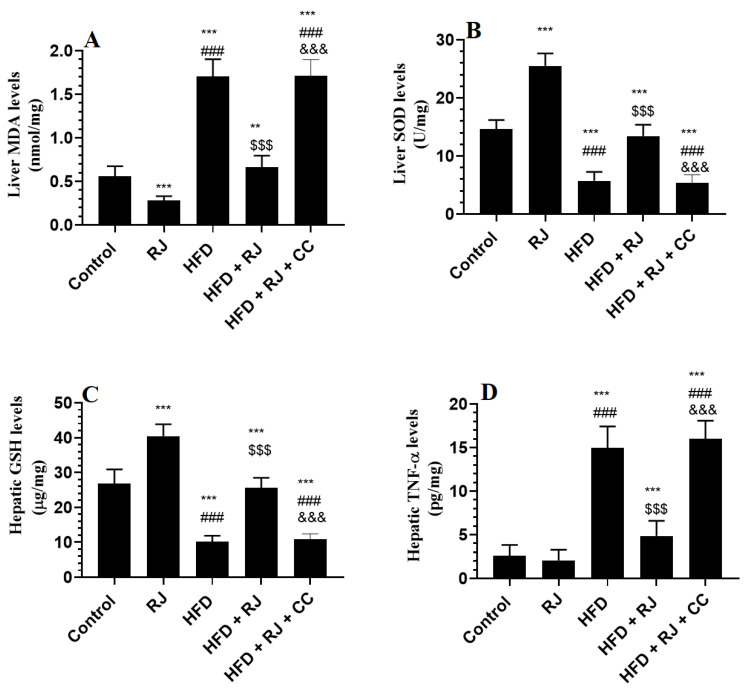
Figure 3.
Markers of oxidative stress and inflammation in the livers of all experimental groups. Data are presented as means ± SD (n = 8/group). (**, ***) vs. control at p < 0.01 & 0.001, respectively; (###) vs. RJ-treated control rats at p < 0.001; ($$$) vs. HFD-model rats at p < 0.001; (&&&) vs. HFD + RJ-treated rats at p < 0.001. RJ: royal jelly; HFD: high-fat diet; CC: compound C, an AMPK inhibitor.

