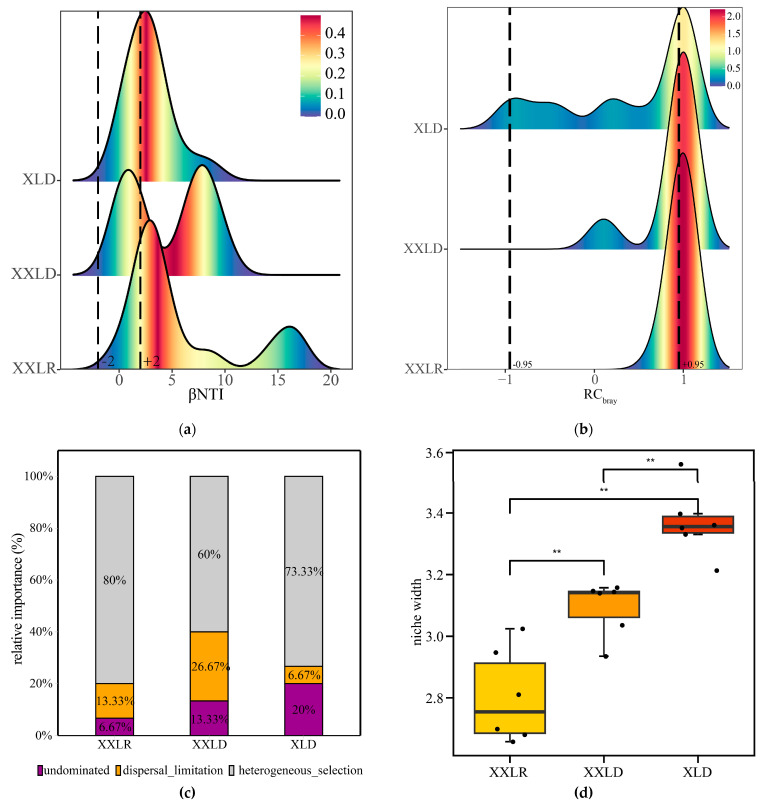
Figure 4.
Distribution of phylogenetic turnover (βNTI; (a)) and taxonomic turnover (RCbray; (b)) and the percentages of the three assembly processes (c) and niche width (d). The vertical dashed lines mark the positions of −2 and 2 in panel a and −0.95 and 0.95 in (b). The percentages on the bar graph indicate the relative importance of different assembly processes (c). Significant differences of niche width across the regions were indicated by ** p < 0.01 (d). XXLR: the inlet of the river upstream of XXL, XXLD, and XLD: near the dam of XXL and XL.

