Figure 1.
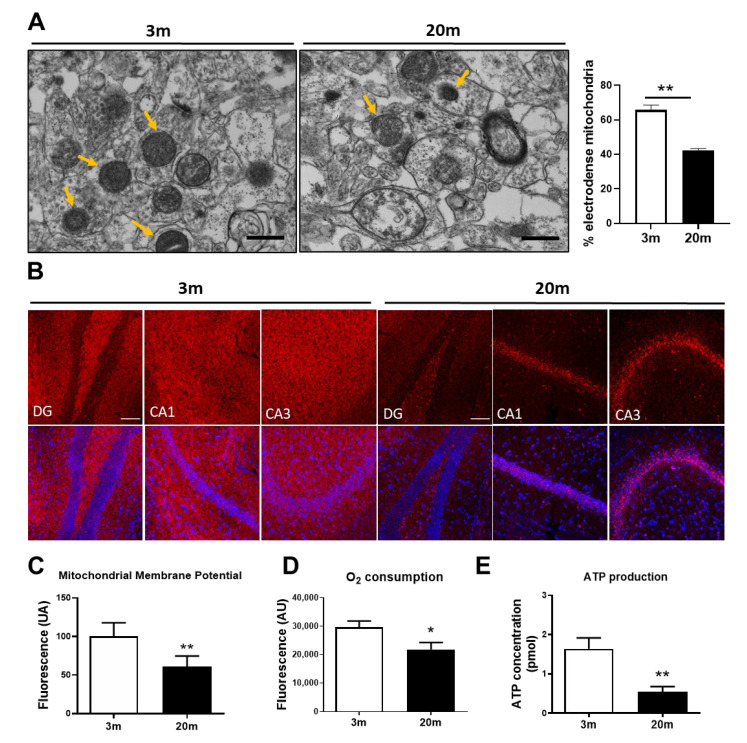
Hippocampal aging reduces energy production and metabolic power of mitochondria in female C57BL/6J mice. (A) Representative transmission electron microscopy (TEM) images of the hippocampal CA1 region of 3 mo and 20 mo mice with its quantification indicating the percentage of electrodense mitochondria (26,500×). Scale bar corresponds to 500 nm. Yellow arrows show electrodense mitochondria. (B) Representative images of non-fixed hippocampal tissue stained with MitoTracker Red CM-H2Xros (MitoRedΨ), as a mitochondrial membrane potential (MMP) indicator. Immunofluorescence images (20×) of three hippocampal regions. DG Dentate Gyrus, CA1 Cornu ammonis 1, CA3 Cornu Ammonis 3. The scale bar corresponds to 100 µm. (C) Mitochondrial membrane potential measured by quantitative analysis of fluorescence intensity of MitoRedΨ in an isolated mitochondrial fraction. (D) Oxygen Consumption in isolated mitochondria of hippocampal tissue, evaluated with a detection kit. (E) ATP content in the hippocampal tissue of 3 mo and 20 mo mice, measured with an ATP Bioluminescence detection kit. n = 5 different animals of each age. Graph bars represent means ± SEM. * p < 0.005; ** p < 0.01.

