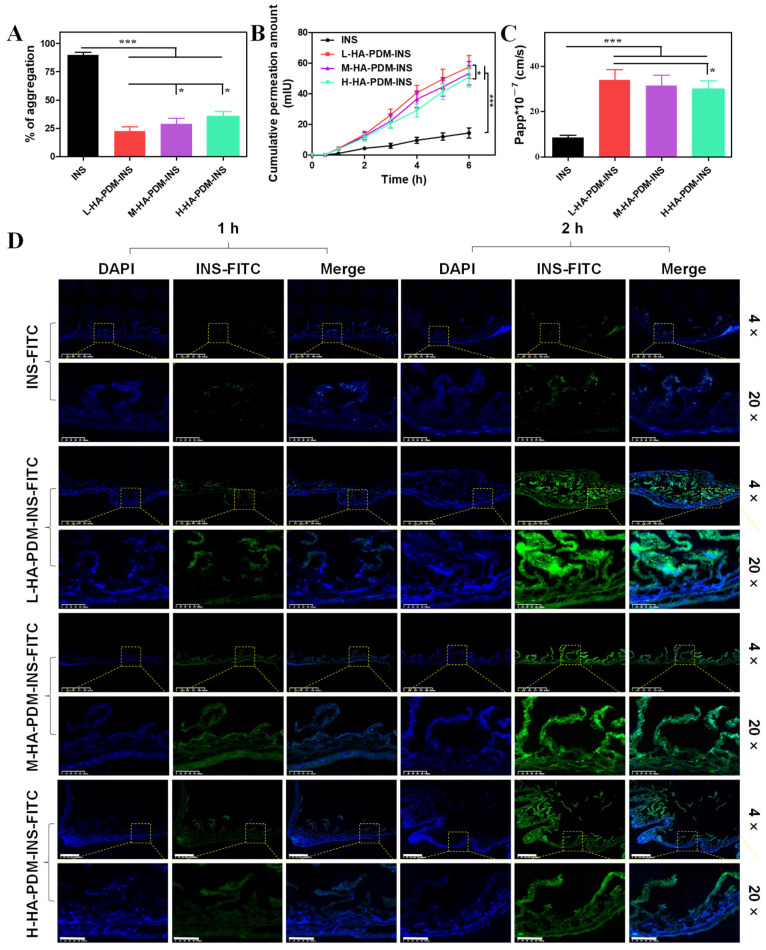
Figure 6.
(A) Aggregates of free insulin, L-HA–PDM–INS, M-HA–PDM–INS, H-HA–PDM–INS, and mucins (X ± SD, n = 6, * p < 0.05, *** p < 0.001). (B) Permeation studies of insulin from L-HA–PDM–INS, M-HA–PDM–INS, and H-HA–PDM–INS across the intestinal loops (X ± SD, n = 6, * p < 0.05, *** p < 0.001). (C) Apparent permeability coefficient (Papp) of insulin across isolated intestinal sections (X ± SD, n = 6, * p < 0.05, *** p < 0.001). (D) Confocal micrographs of the small intestinal villi sections after incubated with different formulations for 1 and 2 h, scale = 100 μm.

