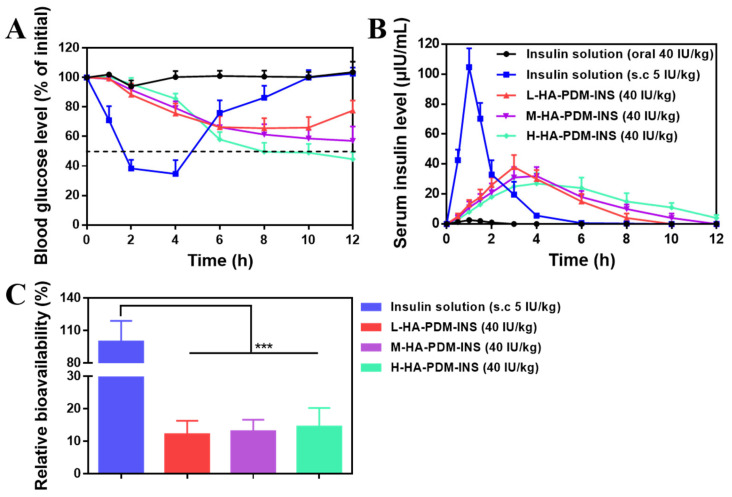
Figure 8.
(A) Blood glucose level vs. time profiles of the diabetic rats following the administration of different formulations (X ± SD, n = 6). (B) Serum insulin level vs. time profiles of diabetic rats following the administration of different formulations (X ± SD, n = 6). (C) Relative bioavailability (X ± SD, n = 6, *** p < 0.001).

