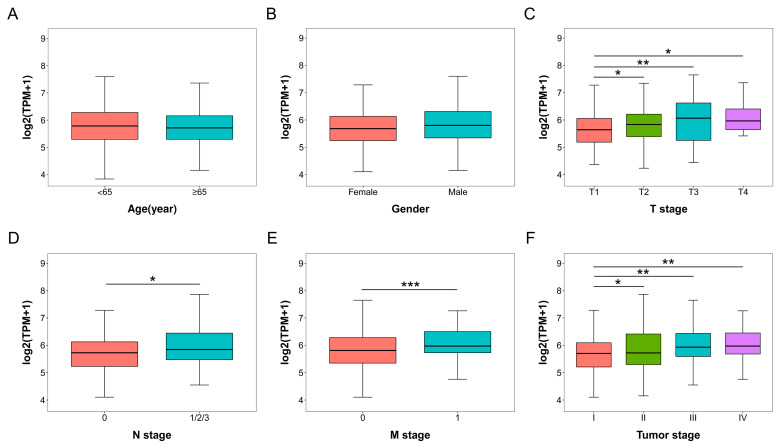
Figure 2.
COA6 mRNA expression in different clinical subgroups of LUAD patients in TCGA. (A) Age; (B) Gender; (C) T (the size of the tumor) stage; (D) N (lymph node metastasis) stage; (E) M (distant metastasis) stage; (F) Tumor (the size of the tumor, lymph node metastasis, and distant metastasis) stage. t−test of independent samples was used in comparing the means of two groups, * p < 0.05, ** p < 0.01, *** p < 0.001.

