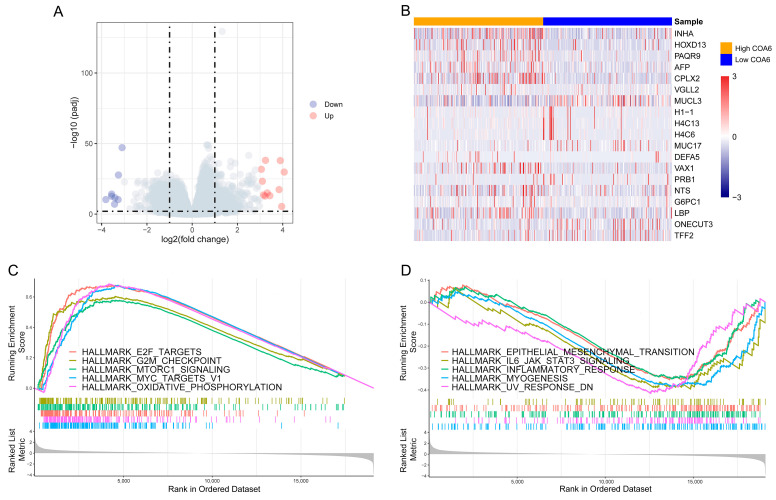
Figure 5.
GSEA of DEGs between high and low COA6 groups. (A) Volcano map of DEGs; (B) Heatmap of DEGs with significant differences (p.adjust < 0.01, log2foldchange > 3). (C) The top 5 activated hallmark pathways in the high COA6 group; (D) The top 5 suppressed hallmark pathways in the high COA6 group.

