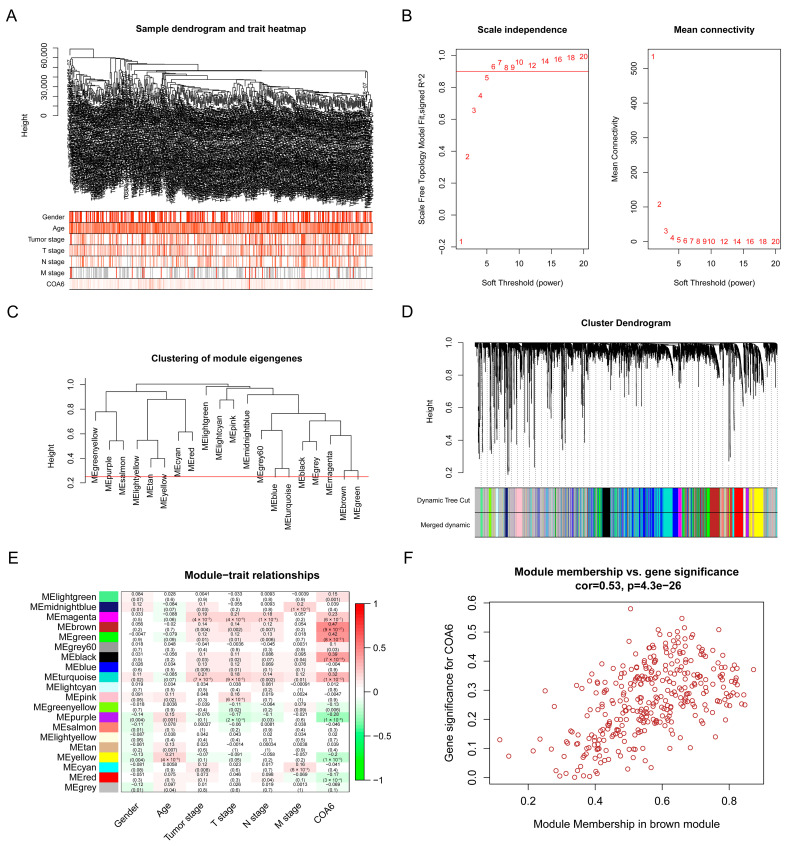
Figure 6.
Screening for key modules related to COA6 in TCGA- LUAD through WGCNA. (A) Sample dendrogram and trait heatmap; (B) Calculation of the scale-free fit index of various soft-thresholding powers; (C) Clustering of module eigengenes. The red line indicates mergeCutHeight (0.25); (D) Clustering dendrograms; (E) Correlation heatmap between module eigengenes and clinical parameters and COA6; (F) Scatter plot of brown module eigengenes.

