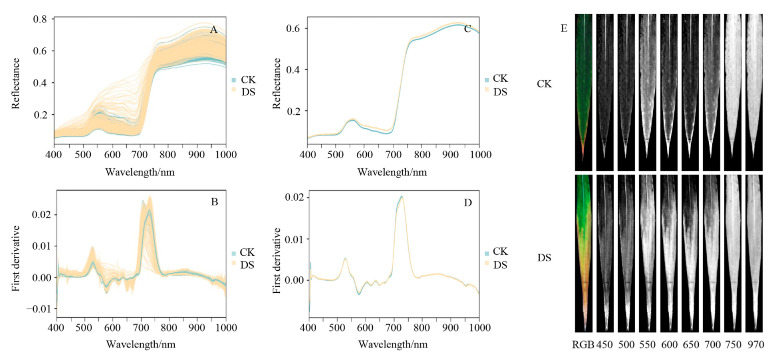
Figure 2.
Hyperspectral curves and single-band hyperspectral images of wheat leaves under different soil moisture conditions. Hyperspectral reflectance and first derivative curves of leaves from 335 wheat varieties under control (CK) and drought stress (DS) conditions; (A,B) hyperspectral reflectance curves of leaves and first derivative values; (C,D) mean hyperspectral reflectance curves of leaves and first derivative values; (E) single-band hyperspectral images; hyperspectral band region (400–1000 nm); hyperspectral images obtained using the Pika L hyperspectral imaging system; RGB images (red = 640 nm, green = 550 nm, blue = 460 nm).

