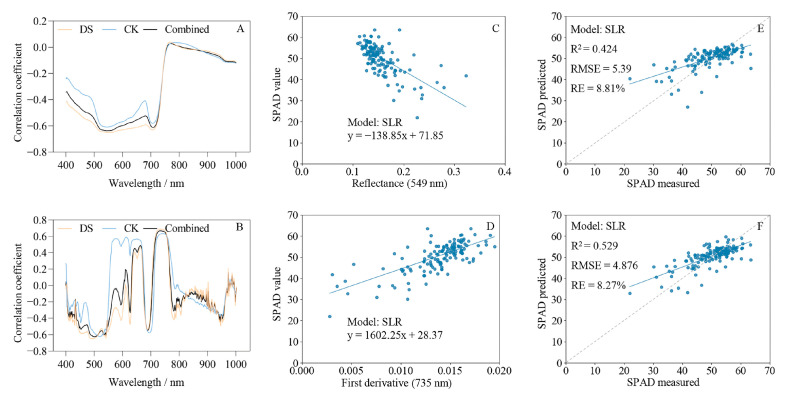
Figure 3.
Correlation analysis and fitting results between leaf hyperspectral and SPAD values. (A,B) Correlations of spectral reflectance and the first derivative with SPAD values; (C,D) simple linear regression (SLR) analysis based on spectral reflectance at 549 nm and the spectral first derivative at 735 nm; (E,F) fitting results of predicted and measured values of SPAD based on reflectance at 549 nm and the first derivative at 735 nm. The gray dotted line is the 1:1 fit line between the predicted and measured values. Pearson correlation analysis of hyperspectral reflectance and first derivatives with SPAD values in CK, DS, and combined data sets was performed using Prism 9. Python 3.6 was used for SLR analysis of the data. CK, control; DS, drought stress; combined, all data.

