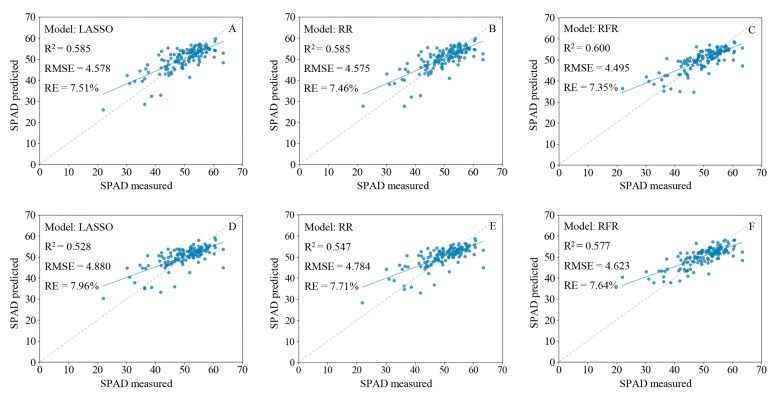
Figure 6.
Fitting results of predicted and measured SPAD values of wheat leaves based on a full-band hyperspectral reflectance and first derivative model. (A–C) Least absolute shrinkage and selection operator (LASSO) regression, ridge regression (RR), and random forest regression (RFR) models built with full-band hyperspectral reflectance; (D–F) LASSO regression, RR, and RFR models built with full-band hyperspectral first derivative. The gray dotted line is the 1:1 fit between the predicted and measured SPAD values, and the blue solid line is the actual fit between predicted and measured values.

