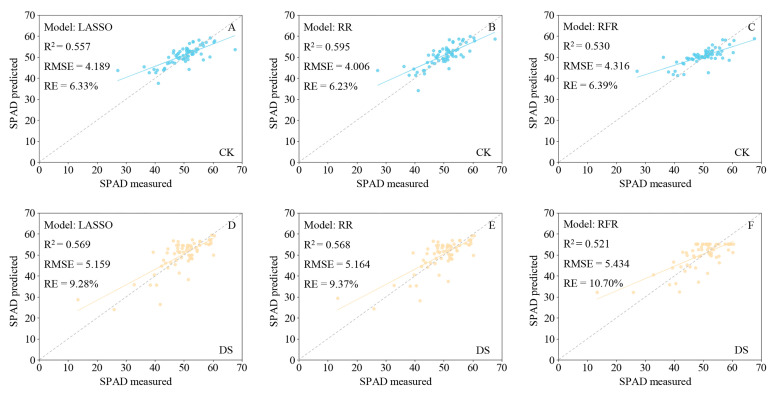
Figure 7.
Fitting results of predicted and measured SPAD values of wheat leaves based on a full-band hyperspectral reflectance model under different soil moisture conditions. (A–C) Least absolute shrinkage and selection operator (LASSO) regression, ridge regression (RR), and random forest regression (RFR) models under the control condition; (D–F) LASSO regression, RR, and RFR models under the drought stress condition. The blue and yellow solid lines are the actual fit between predicted and measured values, and the gray dotted line is the 1:1 fit between the predicted and measured SPAD values. CK, control; DS, drought stress.

