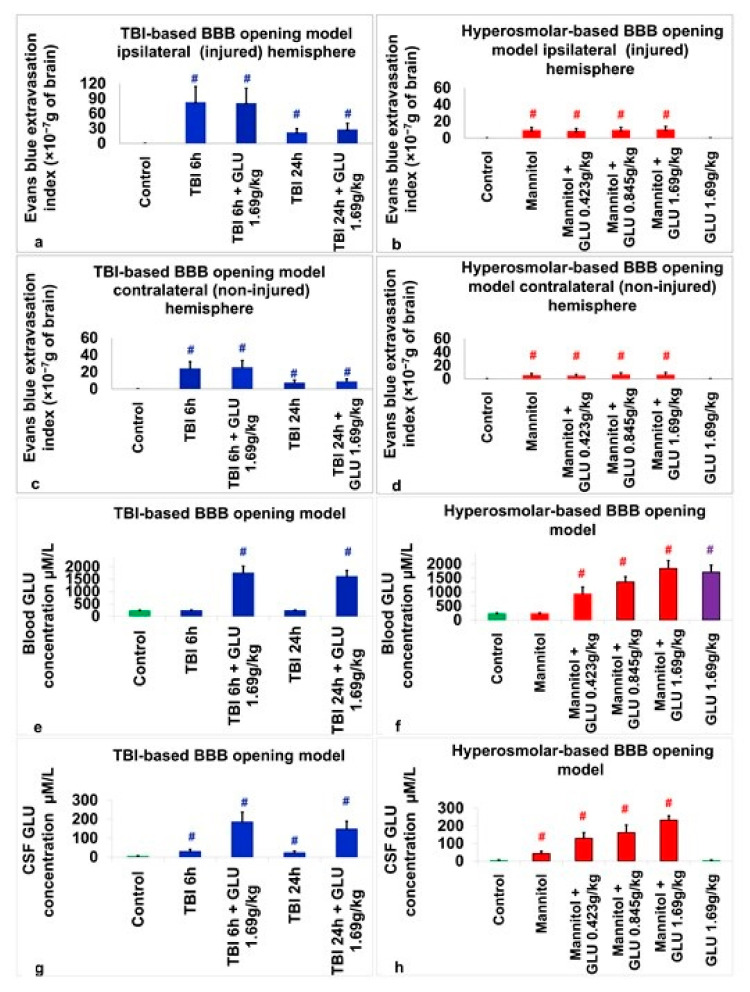
Figure 1.
Changes in the brain and blood glutamate concentrations and outcomes in histological assessments of BBB breakdown in study groups compared to control groups. (a) Evans blue extravasation index in the injured hemisphere between groups for the TBI-based BBB opening model. (b) Evans blue extravasation index in the injured hemisphere between groups for the hyperosmolar-based BBB opening model. (c) Evans blue extravasation in the non-injured hemisphere between groups for the TBI-based BBB opening model. (d) Evans blue extravasation index in the non-injured hemisphere between groups for the hyperosmolar-based BBB opening model. (e) Blood glutamate concentrations between groups for the TBI-based BBB opening model. (f) Blood glutamate concentrations between groups for the hyperosmolar-based BBB opening model. (g) CSF glutamate concentrations between groups for the TBI-based BBB opening model. (h) CSF glutamate concentrations between groups for the hyperosmolar-based BBB opening model. The colors used in the figure correspond to different experimental groups. Specifically, green represents the control group, red corresponds to groups where BBB disruption was induced using the hyperosmolar-based BBB opening model, blue represents groups where BBB disruption was induced through the TBI-based BBB opening model, and purple represents the group that received intravenous glutamate but did not undergo BBB disruption. # p < 0.01.

