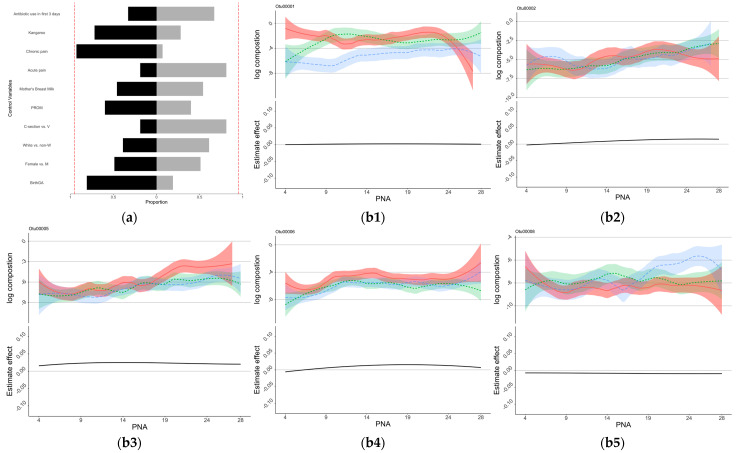
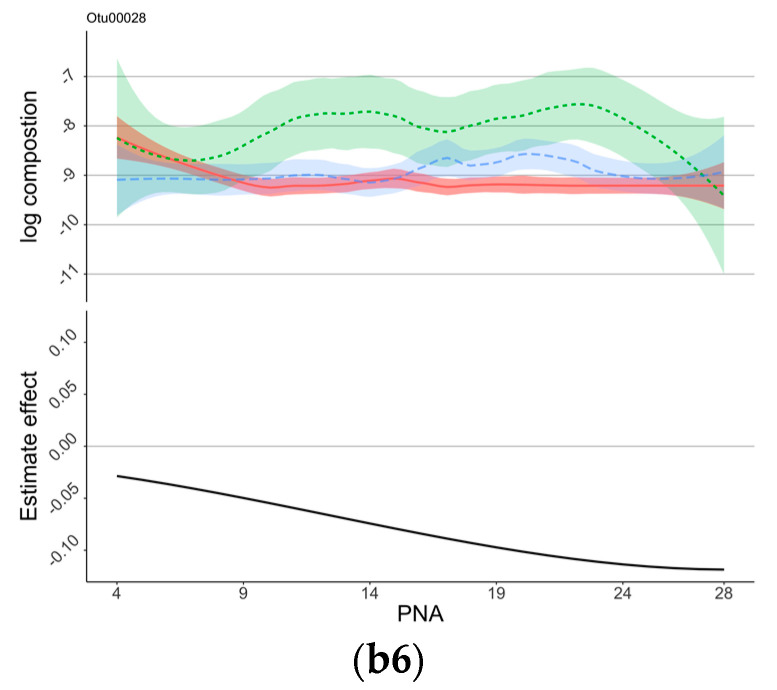
Figure 3.
Control sign and OTUs for NHANDLING. (a) Control sign and NHANDLING. (b) OTUs associated with NHANDLING scores. (a) The proportions of the signs of the estimated coefficients of the control variables. Proportions of negative signs were shown as black blocks to the right, and those of positive signs were shown as light gray blocks to the left. Lower NHANDLING scores indicated better development, those variables in black indicated association with lower NHANDLING scores. The red dotted lines show the 90% of bootstrap. (b1–b6) The estimated time-varying effects of OTU on NSTRESS scores during the NICU stay. The x-axis represents the days after birth (PNA, postnatal age), the y-axis represents the log composition of the OTU abundance (top panel) and the estimated effect (bottom panel). The top panel “log composition” displays the trend of the log-transformed OTU compositions over the first 28 days of NICU stay for infants with different NHANDLING scores, with the infants being separated into three groups based on their NHANDLING score: High NHANDLING score (plotted in red), medium NHANDLING score (plotted in green), and low NHANDLING score (plotted in blue). The bottom panel “Estimate effect” is the estimated time-varying effects of OTUs on NHANDLING scores during the NICU stay.


