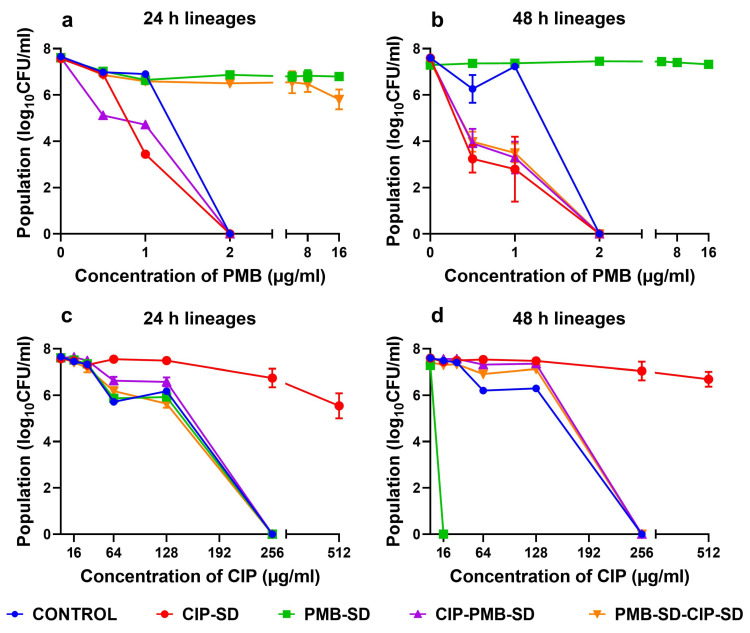
Figure 8.
Population analysis profiles of lineages against PMB and CIP (mean ± SEM, n = 3). Lineages were treated with different antibiotics and have been coded by the names in the experimental design of the time–kill assay (Figure 1 and Table 3). (a,c) The results of lineages (after 24 h treatment in the time–kill assay) against different concentrations of PMB and CIP in the population analysis respectively; (b,d) the results of lineages (after 48 h treatment in the time–kill assay) against different concentrations of PMB and CIP in the population analyses, respectively.

