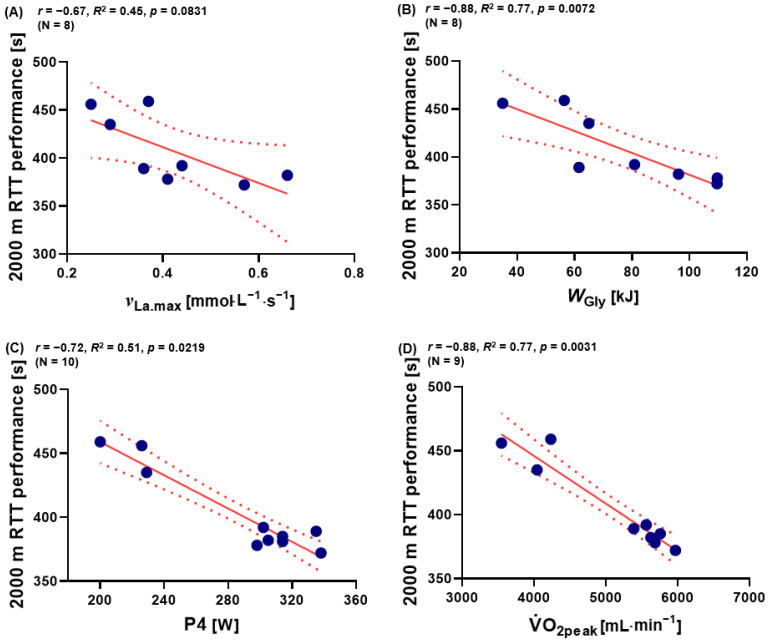
Figure 4.
Relationship between (A) 2000 m RTT performance and νLa.max (n = 8), between (B) 2000 m RTT performance and WGly (n = 8), between (C) P4 and 2000 m RTT performance (N = 10), and between (D) 2000 m RTT performance and O2peak (n = 9). O2peak: peak oxygen uptake during 2000 m RTT, P4: mechanical power output at 4 mmol·L−1. Dotted lines: 95% confidence interval, straight line: strength of the linear relationship between two variables.

