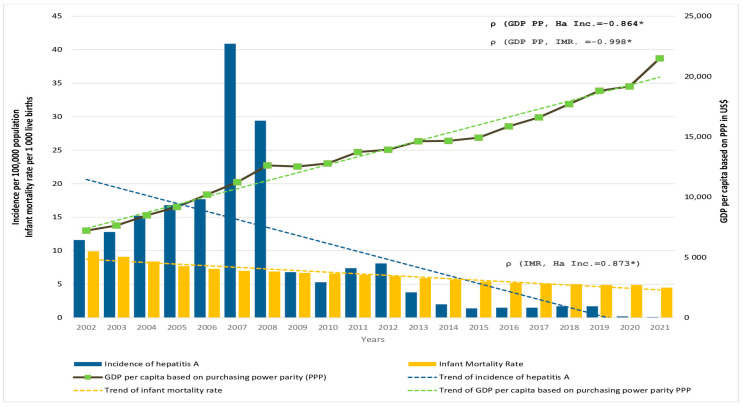
Figure 4.
Incidence of hepatitis A (HA Inc.) per 100,000 population (blue bars, left axis), infant mortality rate (IMR) per 1000 live births (yellow bars, left axis), and GDP per capita based on purchasing power parity (GDP PPP) in US dollars (solid black line, right axis) in Serbia in the period 2002 to 2021. The corresponding trendlines are also shown. * p < 0.001.

