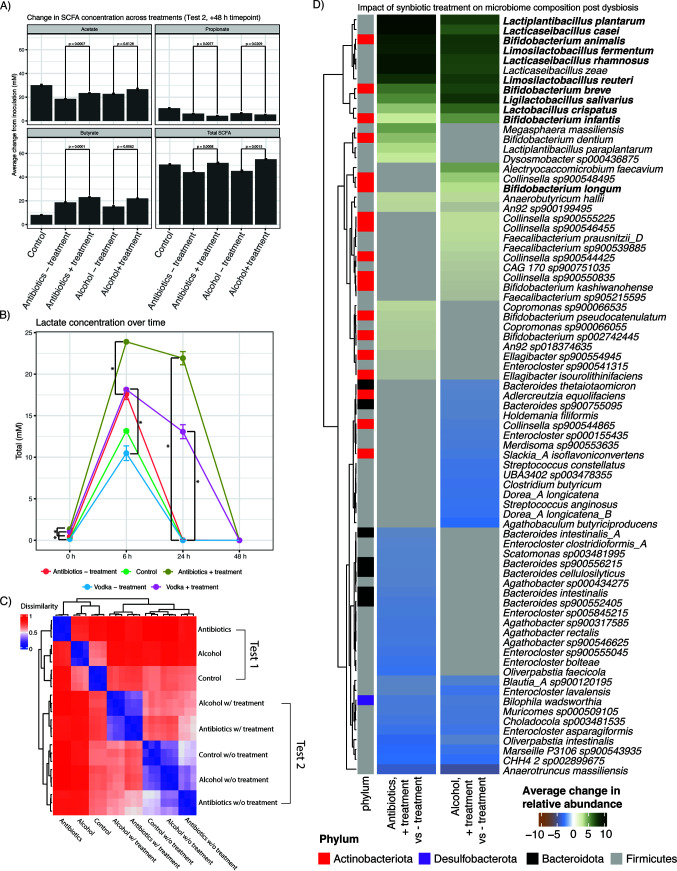
FIG 2.
Response of dysbiotic microbiomes to treatment. (A) Changes in SCFA concentrations across treatment groups. (B) Changes in lactate concentrations over time. (C) Beta diversity values between all reactors with and without stressors and/or synbiotic treatment. (D) Top statistically significant changes (P value of <0.05) in average relative microbial abundances when comparing the reactor with only a stressor (after 48 h of incubation) (Fig. 1A, test 2, control) to the reactor with a stressor and synbiotic treatment (Fig. 1A, test 2). Green indicates taxa that were increased with synbiotic treatment, while blue indicates taxa that were decreased with synbiotic treatment. Gray cells in either of the columns describing abundance shifts indicate a non-statistically significant association. Species in boldface type are those present in the microbial synbiotic used.

