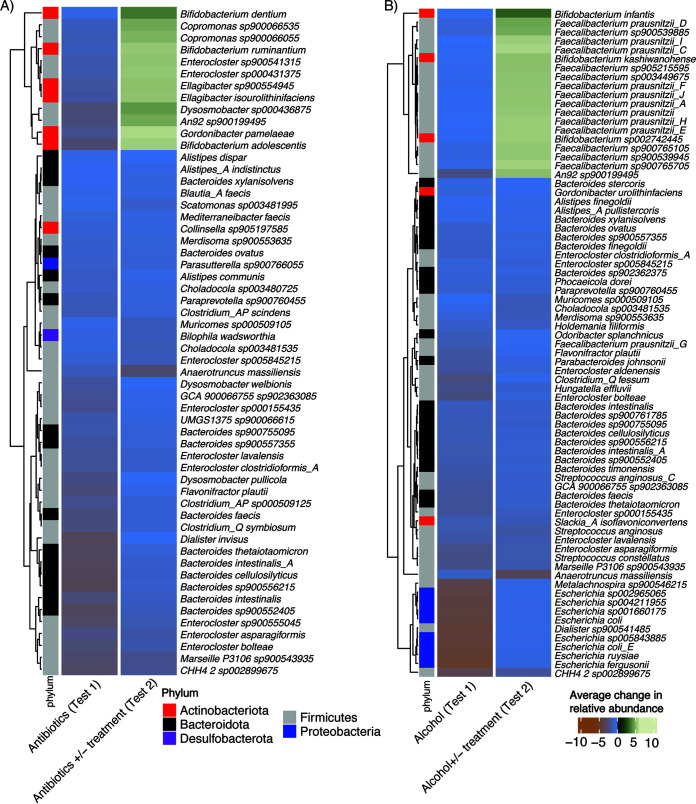
FIG 3.
Impact of synbiotic treatment on the relative abundance of a subset of beneficial microbes reduced by stressors. (A) Antibiotics. (B) Alcohol. The left columns in each panel indicate groups with decreased relative abundances in experiment 1 (when reactors were treated with just stressors). The right columns indicate the average shift in abundance for the same microbes that achieved statistical significance (adjusted P value of <0.05) in the second experiment, when reactors were treated with stressors with or without a microbial synbiotic. Green represents microbes that were increased in relative abundance after treatment with the synbiotic, while blue/orange indicates microbes that were decreased in relative abundance after treatment with the synbiotic.

