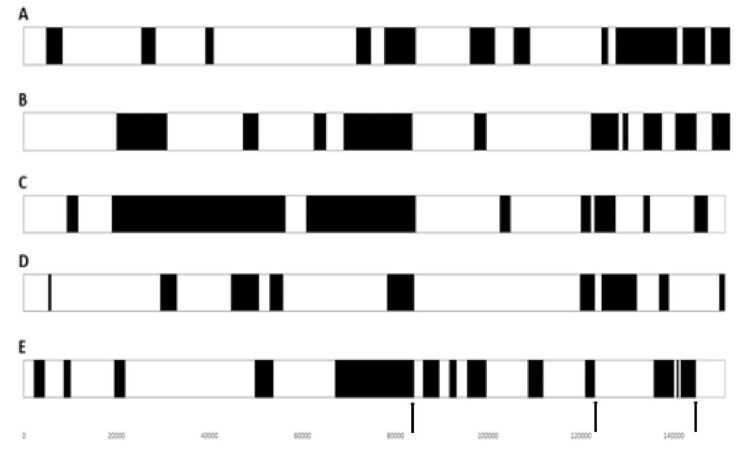
Figure 5.
Graphical representation of the position of the predicted recombination events across the five strains with the highest statistical significance. The events are indicated in black in the white backbone of the viral genome. Possible regions selected for by recombination are indicated by arrows (positions 80,000 bp, 124,000 bp and 141,000 bp). (A) LSDV/KZ-Konstanay/Kazakhstan/2018. (B) LSDV/Russia/Tyumen/2019. (C) LSDV/Russia/Udmurtya/2019. (D) LSDV/Russia/Saratov/2017. (E) LSDV/GD01/China/2020 with permission from A. Sprygin [78].

