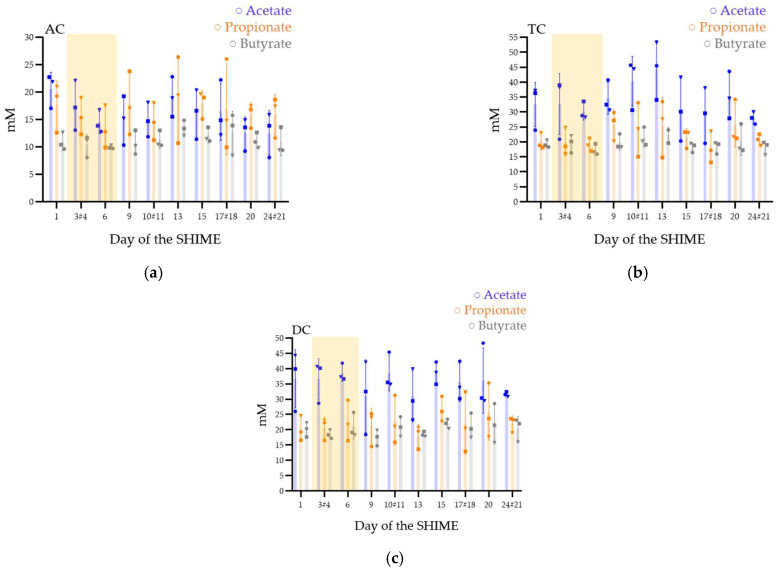
Figure 4.
Short-chain fatty acid production (acetate, propionate, and butyrate) in the ascending (AC) (a), transverse (TC) (b), and descending (DC) (c) colons in the SHIME® model after one daily ULIP33 phage injection (10 mL at 109 PFU/mL) in the ascending colon for 7 days. Mean concentrations (±SD) are presented in mM for acetate (blue bars), propionate (orange bars), and butyrate (gray bars); all are quantified using SPME-GC-MS, 3 times a week. Round marks: data of the repetition 1; square marks: data of the repetition 2; triangle marks: data of the repetition 3; yellow frame represents the phage treatment week and # are the samples with a different sample date in the different triplicates.

