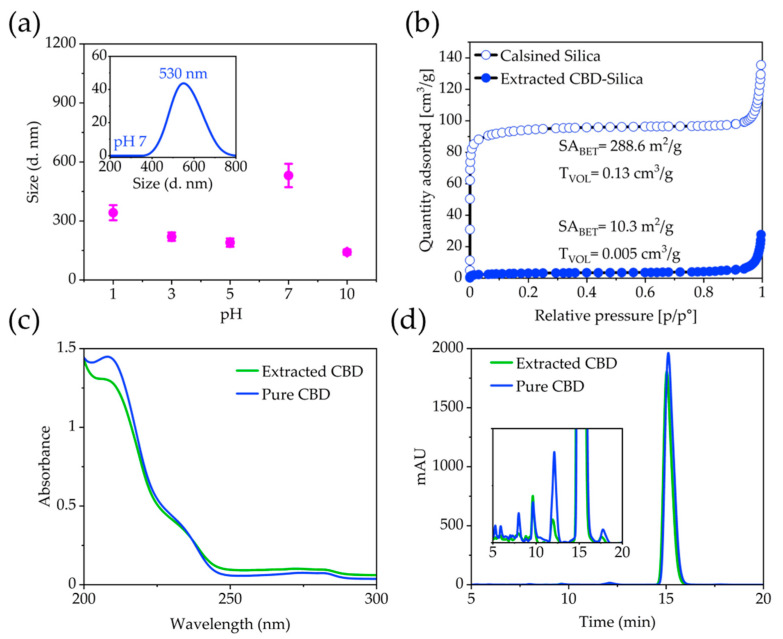
Figure 2.
(a) DLS measurements conducted on CBD-Silica after 10 min sonication as a function of pH. Inset shows the measurement performed at pH 7. (b) N2 adsorption isotherms of extracted and calcined silica samples. Comparison of pure CBD and CBD extracted from silica. (c) UV-Vis spectra of pure and extracted CBD showing the characteristic absorption maximum at 210 nm. (d) Chromatograms of pure and extracted CBD showing a good correlation in the retention time.

