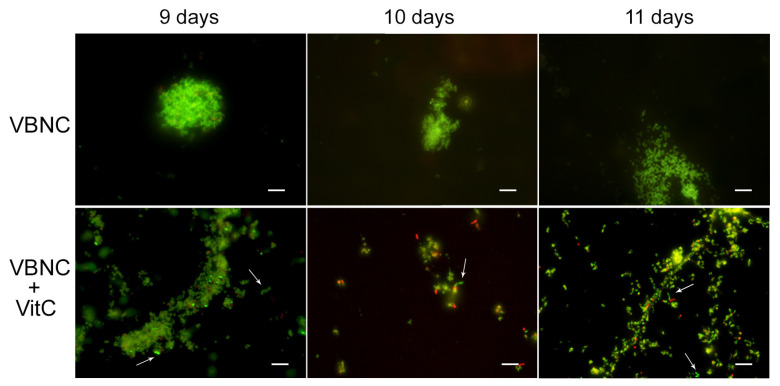
Figure 5.
Effect of VitC on the VBNC state. Representative images of Live/Dead staining showing the effect of VitC on VBNC cells compared to the untreated samples (VBNC): VitC was added after 8 days of incubation after VBNC generation, and its effect was monitored for a further 24 h (9 days), 48 h (10 days), and 72 h (11 days); it was compared with the untreated sample (VBNC). The arrows indicate the viable bacillary forms in the presence of VitC. Original magnification, 1000×.

