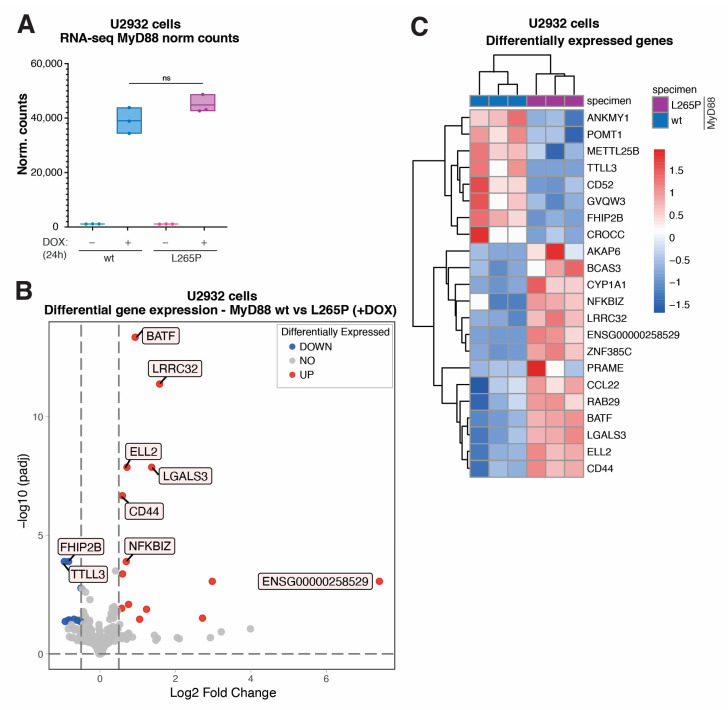
Figure 2.
Transcriptome analysis (RNA-seq) of genes differentially expressed in U2932 lymphoma cells acutely expressing MyD88L265P. (A) MyD88 normalized counts resulted from transcriptome analysis (ns for p > 0.05). (B) Volcano plot showing differentially expressed genes in U2932 cell lines inducibly expressing MyD88 vs. MyD88L265P. The blue dots indicate downregulated genes, and the red dots indicate upregulated genes with Benjamini and Hochberg corrected p-value less than 0.05 and an absolute value of log2 fold change greater than 0.5. (C) Heatmap representation of all the significantly differentially expressed genes (as described in (B)) in U2932 cell lines expressing MyD88 wt vs. L265P.

