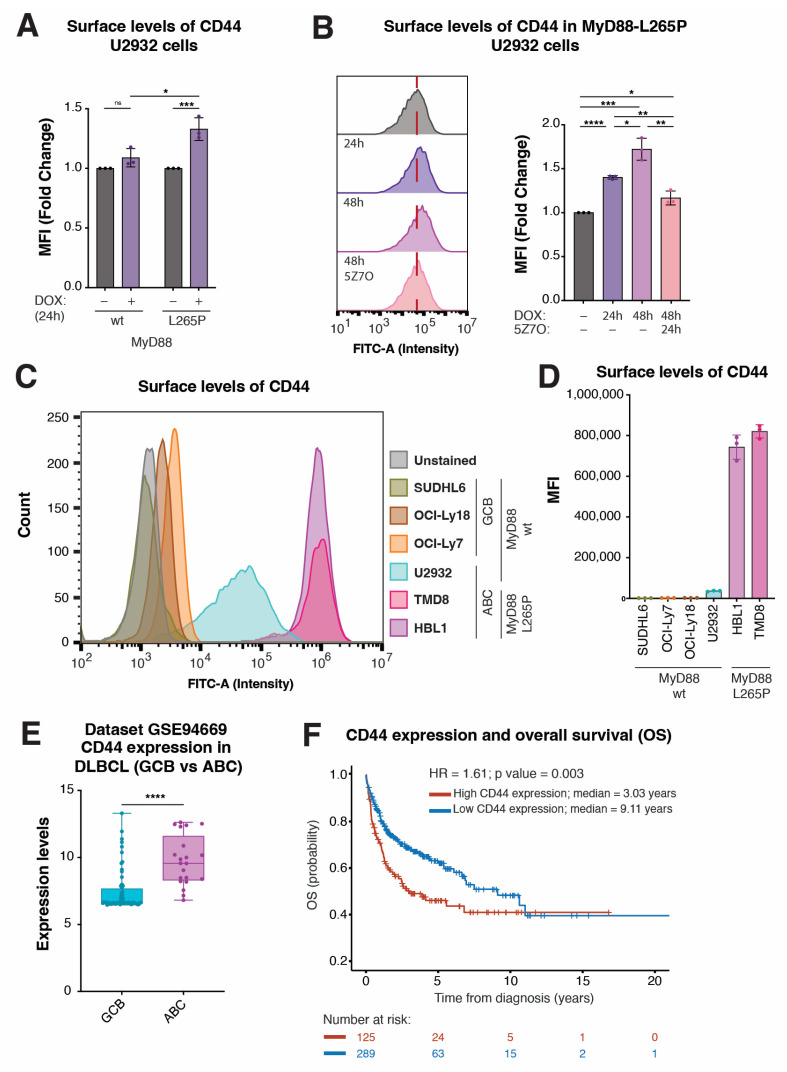
Figure 5.
CD44 levels are correlated with MyD88 L265P expression and predict OS in DLBCL patients. (A) Mean fluorescence intensity (MFI) of CD44-FITC staining obtained with flow cytometry analysis of U2932 cell lines upon MyD88 (wt/L265P) inducible expression after 24 h of DOX treatment. (B) Histogram and related MFI of FITC obtained with flow cytometry analysis of U2932 cell lines upon MyD88 (wt/L265P) inducible expression after DOX and subsequent 5Z7O (1 µM) treatments for the time intervals annotated in the figure. (C) Histogram showing the difference in CD44 surface levels, analyzed with surface staining and flow cytometry in SUDHL6, OCI-Ly18, and OCI-Ly7 cell lines (which represent GCB DLBCL with wt MyD88). The U2932 cell line represents ABC-DLBCL with wt MyD88. HBL1 and TMD8 represent ABC DLBCL with MyD88L265P. (D) Flow cytometry analysis of SUDHL6, OCI-Ly18, OCI-Ly7, U2932, HBL1, and TMD8 cell lines stained with CD44-FITC-conjugated antibody shown as MFI. (E) Validation of CD44 expression levels in the subgroups of GCB and ABCL DLBCL cell lines from the GSE94669 dataset. (F) Kaplan–Meier curves for OS in DLBCL patients using the transcriptome profiling and clinical information of 449 DLBCL patients from GEO dataset (GSE10846; n = 420). The average expression of 13 CD44 probes for each patient was used for overall representation of clinical data. The patients were divided into two groups based on the CD44 expression level. High-CD44 (red) and low-CD44 (blue) groups were determined as described in the Section 4. (ns, not significant for p > 0.05, * for p ≤ 0.05, ** for p ≤ 0.01, *** for p ≤ 0.001, **** for p ≤ 0.0001).

