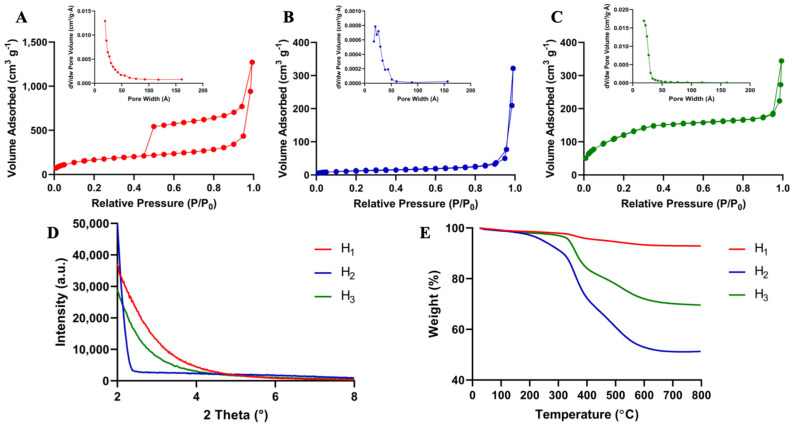
Figure 3.
Characterization of layer-by-layer HMSNPs: (A–C) Nitrogen sorption graphs for H1, H2, and H3 nanoparticles, respectively. All three particles display isotherms characteristic of mesoporous material according to IUPAC classification. Inserts show pore size distribution for nanoparticles in angstrom. H1 and H3 display a single peak while several peaks are observed in H2 due to the decreased formation of uniformed pore structures of the bulky BTEPDS precursor; (D) XRD plots for H1, H2, and H3 nanoparticles. The lack of typical Bragg peaks in all three particles is indicative of a disordered pore structure. This is commonly observed in organosilica nanoparticles; (E) TGA graphs for all the fabricated nanoparticles which exhibit weight loss percentages consistent with layer composition.

