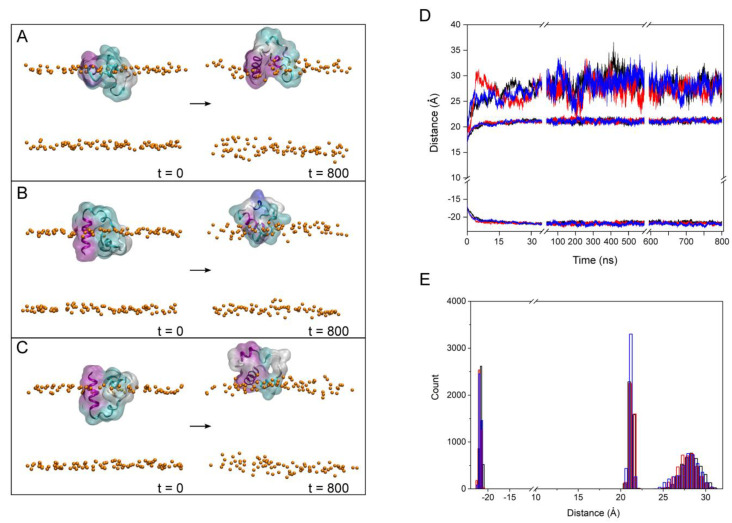
Figure 4.
Initial (t = 0 ns) and final (t = 800 ns) arrangements corresponding to the third step, i.e., model membrane similar to the late endosomal one, for (A) system 3-1, (B) system 3-2 and (C) system 3-3 in the presence of 0.15 M NaCl (MD time 800 ns). The peptides are shown in both ribbon and surface transparent drawing style with coloured secondary structures (white (coil), violet (helix), yellow (extended), light blue (turns)). The phospholipid phosphate atoms are shown in VDW drawing style (orange) and the water molecules. The chloride and sodium ions have been removed for clarity. (D) Time variation of the z-axis distance (centre of the membrane as reference) and (E) distance histograms of the FP peptide and the phosphate atoms of the phospholipids (systems 3-1 (black), 3-2 (red) and 3-3 (blue), last 30 ns of the MD simulation).

