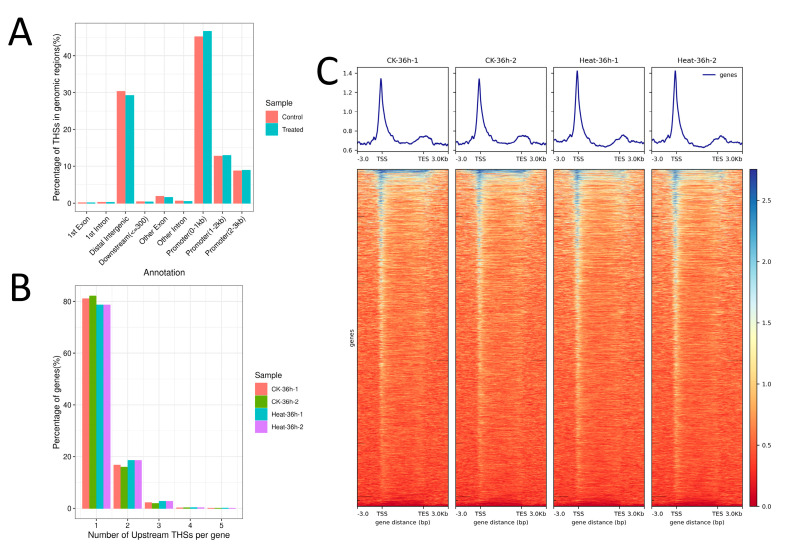
Figure 1.
Distribution of THS in rice under heat stress. (A) THS genomic distribution in control and heat stress treatment (36 h). (B) The distribution of THSs in the upstream region of each rice gene. (C) The average plot and heatmap of ATAC-seq signals for over-enriched THSs in control (CK 36 h-1 and 2) and 36 h heat stress groups (Heat 36 h-1 and 2).

