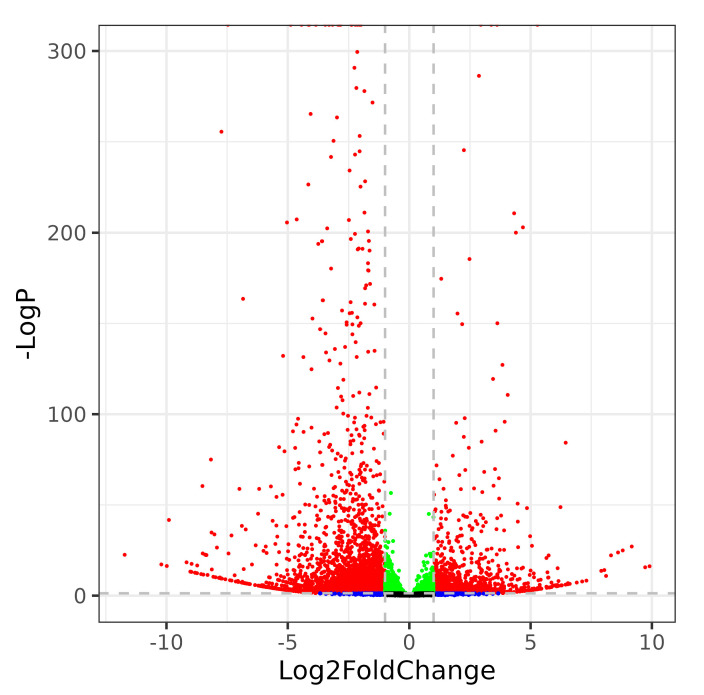
Figure 2.
Distribution of DEGs in rice under heat stress. Red dots represent genes with |log2FC|≥1 and p-Value ≤ 0.05, green dots represent genes with |log2FC| < 1 and p-Value < 0.05, blue dots represent genes with |log2FC|>1 and p-Value > 0.05, and black dots for genes with no obvious statistical significance.

