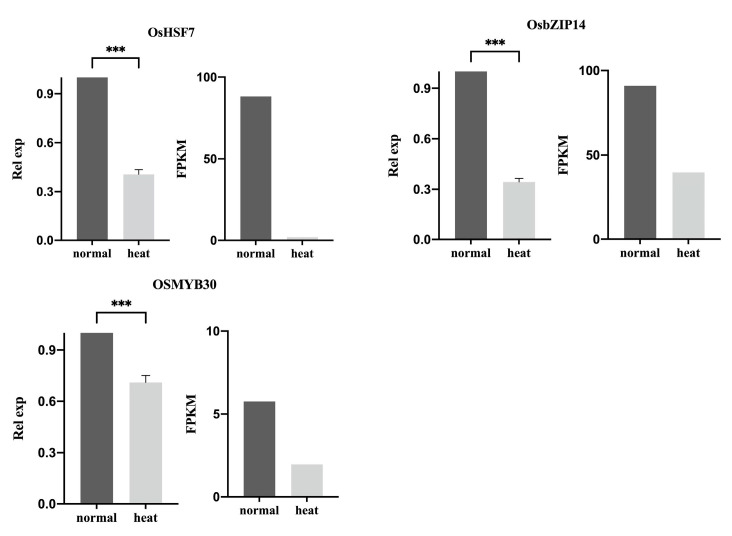
Figure 4.
Expression of OsHSF7, OsbZIP14, and OsMYB30 by using RT-qPCR and RNA-seq methods. The plot on the left side represents the RT-qPCR measurement results, while the right side represents the RNA-seq analysis results. The statistical significance of the expression changes was determined using the student t-test, ‘***’ indicating a p-Value < 0.001.

