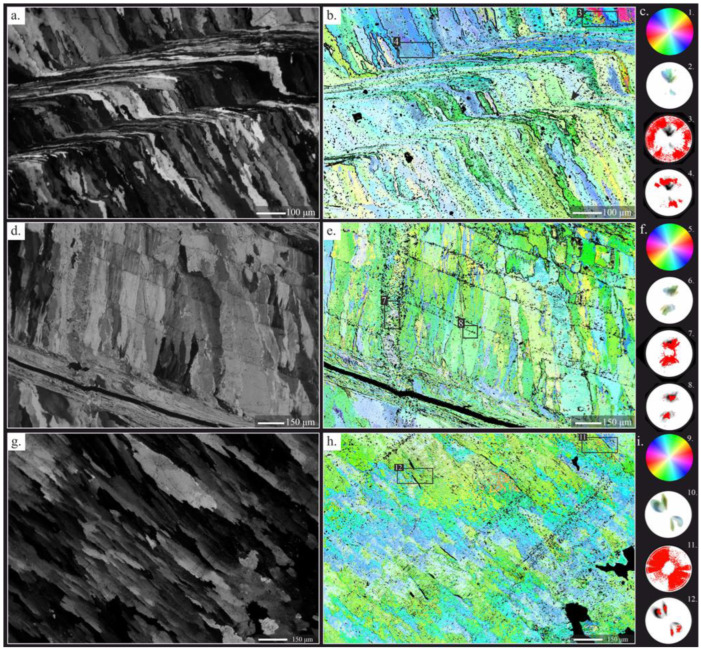
Figure 4.
CIP analysis of thin regions of Gigantoproductus ventral valves (a,d) and thick region (g). Orientation images (b,e,h). Petrographic micrographs of the studied areas (a,d,g). Standard colour lookup table (CLUT) and pole figures (c,f,i). CLUT of the orientation images (1, 5, 9). Pole figures (2–4, 6–8, 10–12). (2) Corresponds to the complete area (b), showing a pole maximum with c-axis which is strictly oriented perpendicular to the growth direction of Gigantoproductus shell. (3–4) Corresponds to selected areas. (3) Columnar area with random c-axis orientations due to recrystallisation. (4) Equivalent area to (3), showing a well-constrained c-axis orientation. (6) Corresponds to the complete area (d). (7–8) Corresponds to selected areas. (7) Fracture with degrading neomorphism, which preserves the original crystallographic orientation. (8) Equivalent area to (7), showing a better constrained c-axis orientation. (10) Corresponds to the complete area (g), showing a pole maximum, with c-axis which is strictly oriented perpendicular to the growth direction of the Gigantoproductus shell. (11–12) Corresponds to selected areas. (11) Prismatic area with random c-axis orientations, due to recrystallisation. (12) Equivalent area to (11), showing a well-constrained c-axis orientation. Pole figures were calculated as an orientation-distribution function and are provided in multiples of uniform distribution intervals of 0.5 for c-axis orientations of the complete area. Red points correspond to the punctual c-axis orientation of each pixel of selected areas.

