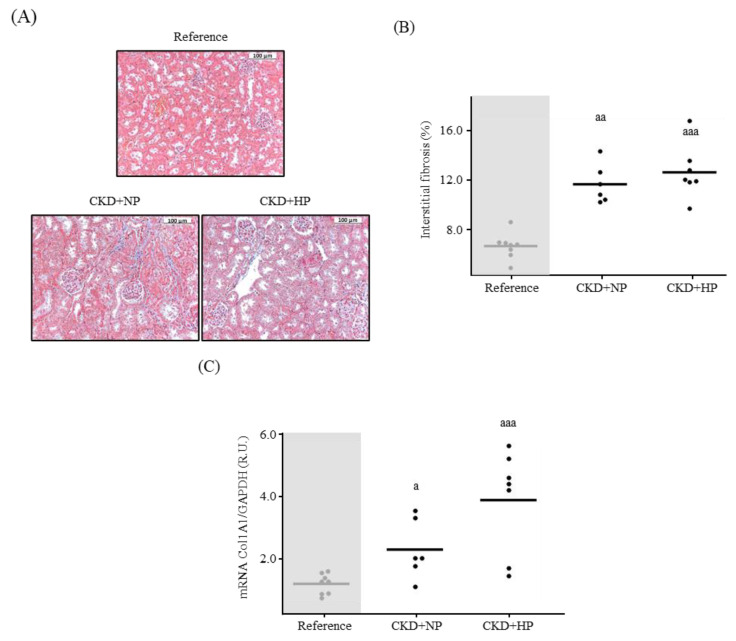
Figure 1.
In vivo effects of chronic kidney disease (CKD) and dietary phosphorus intake on kidney fibrosis. (A) Representative images for kidney interstitial fibrosis and (B) quantification from Sham-operated (Reference) and CKD mice fed a normal phosphorus (NP) or high phosphorus (HP) diet for 14 weeks. Each inset indicates the relative scale in µm. Mean and individual mice values are shown. aa p < 0.01 and aaa p < 0.005 vs. Reference. (C) Kidney Collagen 1 mRNA levels. All values are expressed relative to Reference group. Mean and individual mice values are shown. a p < 0.05 and aaa p < 0.005 vs. Reference. R.U., relative units vs. Sham+NP. GAPDH was used as housekeeping gene.

